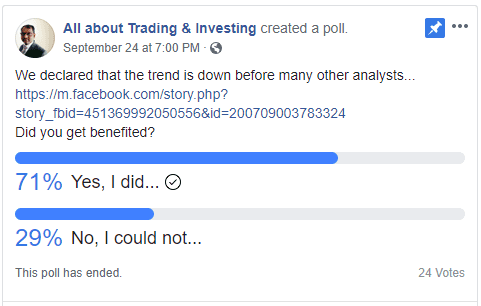
On 11 Sep, when Nifty was at 11,415, we have already declared that possibly a correction has started in Nifty here is the link.
As per the poll on facebook, about 71% of our followers were able to act in time that saved them from losing large amount.
We are getting some queries if we are in bear phase and if they should liquidate their portfolio and if they should start investing again. Here is the effort to answer those queries.
We believe that Next Nifty supports are based at following levels –
- Immediate daily support – 9,950 to 10,000
- Weekly gap, 2 tops – 8888 to 9015
- Daily (minor Support) – 7885 – 7985
- Weekly Major support – 6820 – 7050
At this point we believe that market will reverse from either of these levels and if we see any further downside, we will post a new post here.
Price is about valuation
Lets start with valuation understanding. We see some posts mentioning that stocks are up for sale as they have fallen 50%. In our earlier posts, we have proven with data how dangerous it could be to buy at lows compared to high. Refer – Best time to buy a stock – 52 week high or 52 week low
On PE chart (reference – https://nifty-pe-ratio.com/ )
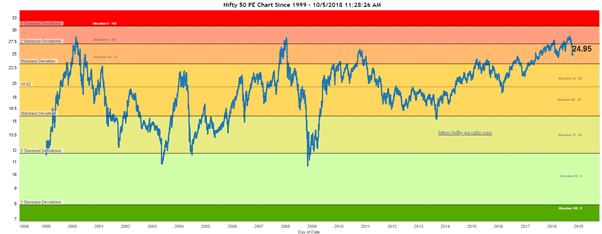
we see that Nifty has started coming down from 3rd standard deviation to 2nd with current levels of 24.95. Before last 2 corrections Nifty PE was in 3rd standard deviation and when it corrected, it came all the way to other side on 3rd standard deviation with value around 11 to show a reversal. This swing in valuation was more than 50% correction both the times. As an informed investor, I would at least expect it to come to average of 19.52. Below are the calculations –
With P/E ratio of 24.95 we are at 10,263, Nifty earnings are at 411.34. If we consider earnings growth of 20% in best case scenario earnings would be about 493.61. If you calculate Price with these, it looks like –
|
PE ratio |
Price without earnings growth |
Price with earnings growth |
|
19.52 |
8030 | 9635 |
| 11.00 | 4525 |
5430 |
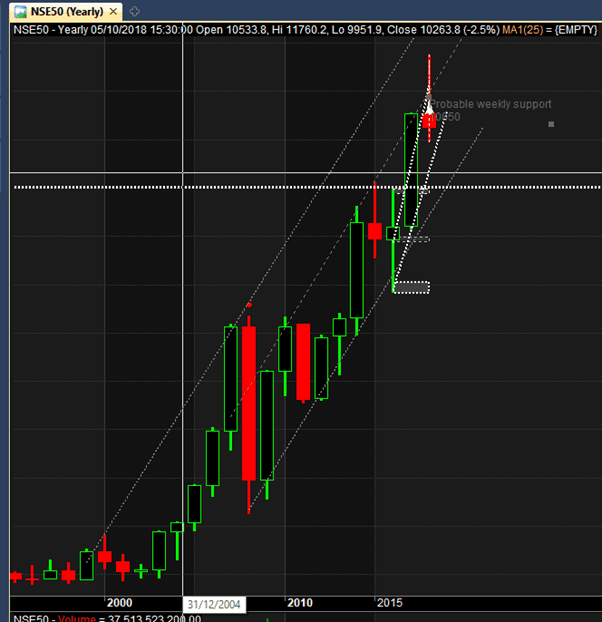
The Yearly chart
To respond to those who call every small correction a bear market, Here is yearly chart of Nifty. This is definitely a bull market.
The Quarterly chart
On Quarterly charts we see A-B-C-D harmonic pattern plus an RSI divergence. But be informed that last candle is not yet complete and for this to be valid high of current quarter should not be broken.
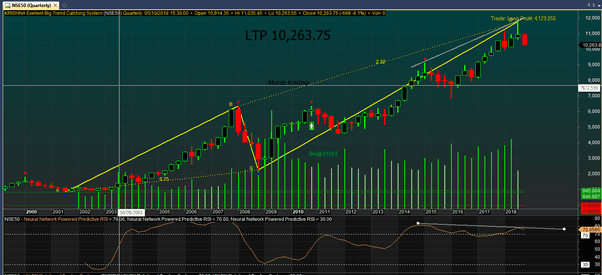
We have seen supply demand levels on Quarterly charts earlier.
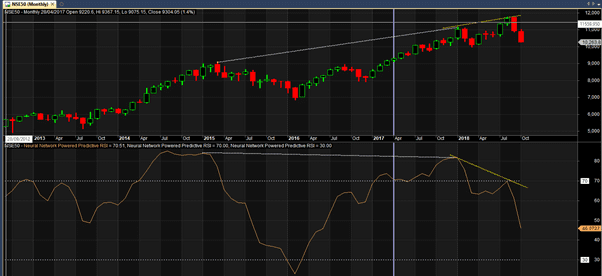
The Monthly chart
The most important thing visible on monthly chart is back to back divergence. This confirms that we are in correction.
The Weekly chart
This is the scariest of the charts for me. Weekly Major support is right at 6820 – 7050 levels. Which makes me believe that there is a possibility of 40-50% correction this time around. However I also see past resistance level which was broken with a gap which comes around 8888 to 9015 levels. Markets have tendancy to close all the gaps. Apart from this gap, there is another gap all the way to 5688-5825 levels
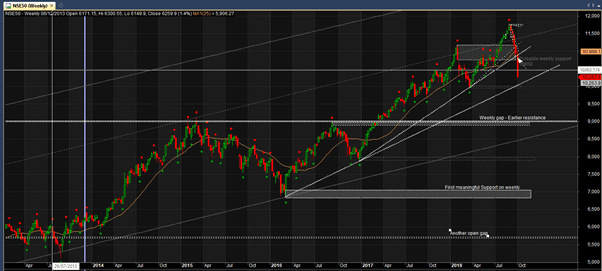
Looking at RSI on monthly and these levels, 9000 Nifty looks to be high probability zone. That is where I want to evaluate good stocks to buy and deploy some of cash. But if 9000 is broken on Nifty, we may see a much deeper correction to 40-50%
The daily chart
On daily charts the point worth mention is that a strong weekly support level of 10,850 was broken with a gap. This is a strong message from bears to bulls. It also shows how bulls were caught wrong footed to have their SL triggered. When such thing happens, they may not have any immediate courage to go past this level. So this becomes our immediate next SL for going short.
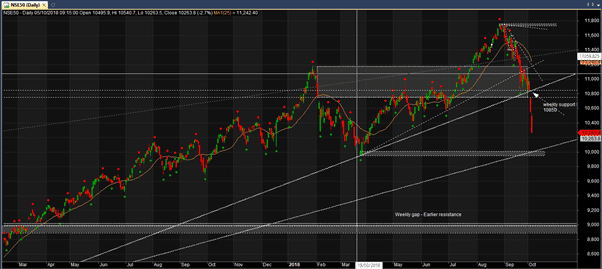
Immediate daily support is at – 9,950 to 10,000 levels and it would be interesting to see the bull bear battle at this place. However, I don’t expect this to be a level for markets to turn around looking at monthly RSI and PE analysis above.
When it is good time to buy, we will recommend stocks to go for. For now, one may use any bounce to reduce exposure.
Really a nice analyasis
Nice analysis Sir