In today’s Market Analysis we have supporting videos to make it much more interesting and clear for our viewers.
PE Analysis
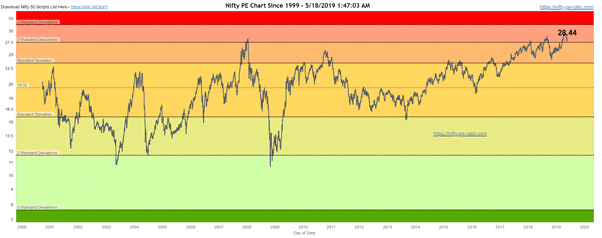
We will start the usual way which is PE ratio charts with makes us cautious in markets, rather on bear side. As mentioned many a times, Nifty is trading very close to all time high in PE perspective and there should be a decent enough correction as valuations look very stressed from PE perspective
Monthly and Weekly shows RSI in overbought zone with double divergence
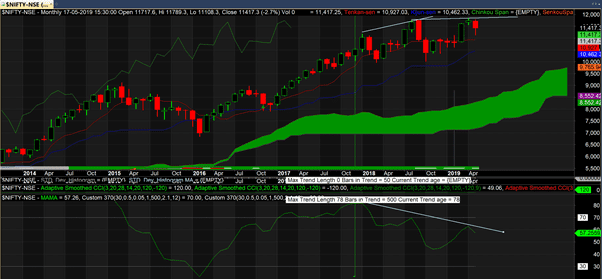
Monthly charts show divergence on RSI
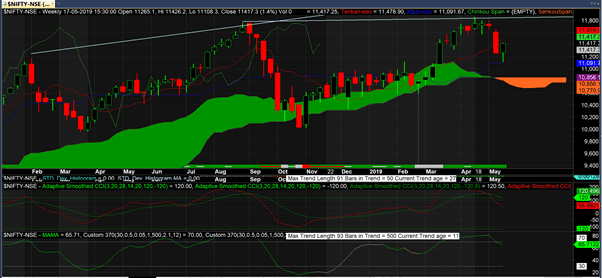
Weekly charts show RSI to be in overbought zone – ready for next correction
Supply Demand Analysis
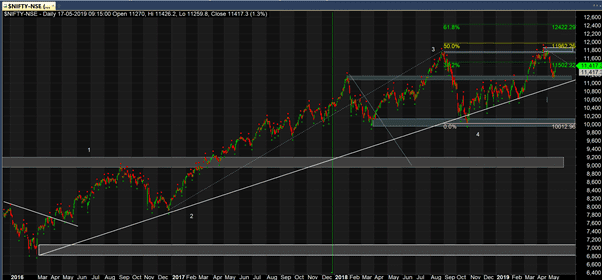
We have a very good support line coming up around 11,000 levels which is also a good demand zone from where markets reversed last week and until that is brken, the markets seem to be having upside bias. Its important to note that we are in deed in a downward bias in daily charts. However expecting 11000 support to act as demand zone, we should see an upmove.
If we look at Elliot wave analysis – it looks like we are in wave 5 and if we use Fib analysis a 61% of wave 3 seems to be a good target being at 12,400 levels.
The regression channels
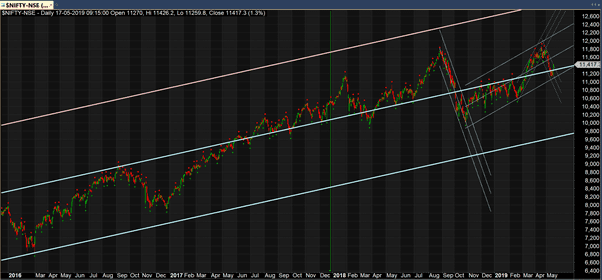
In long term analysis we are definitely in long term bull zone. Both side regression channels are far enough and a longish move on both side is expected. Since we are close to middle of zone writing both calls and puts may be useful.
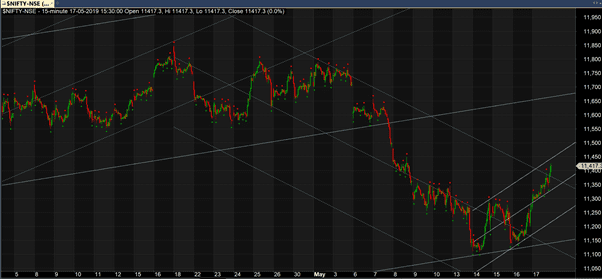
If we look at regression channels on lower timeframes, we see that the latest downward regression channel is actually broken and new upward channel is also in place. This makes s believe that immediate next trend for Nifty may be up with a SL around 11,150
Options Analysis
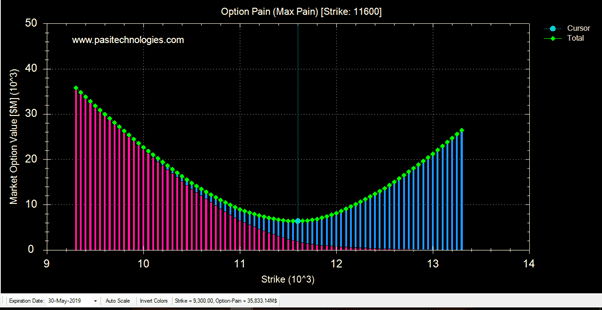
Max Pain for 30 May (monthly) option is at 11,600
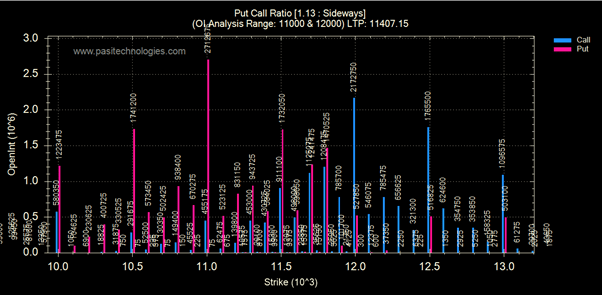
Highest Puts being written at 11K and highest calls at 12K with a healthy Put call ratio of 1.13
Based on Option data, it looks like that the market may be neutral with upward bias