On 17 Aug we mentioned a good risk reward possible trade on downside. “ If we go short at these levels around 11,000 a profit potential of about 850 points with a risk of about 250 points”. Lets review today how markets performed against that view.
Nifty Monthly
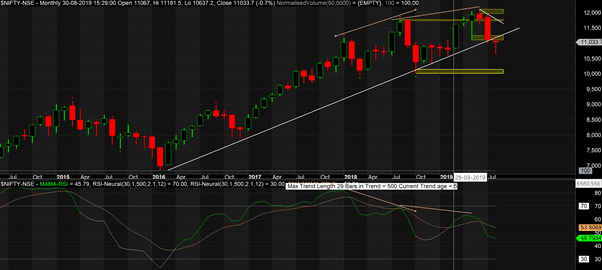
We have mentioned earlier on double divergence on monthly charts. But at end of last month, we see the whole monthly candle below the support line on weekly charts. This should be anther warning that we are here to see lower levels. However monthly candle suggests buying at lower levels. I would give lower importance to the candle pattern at this point in time – why? I mention below.
Nifty weekly
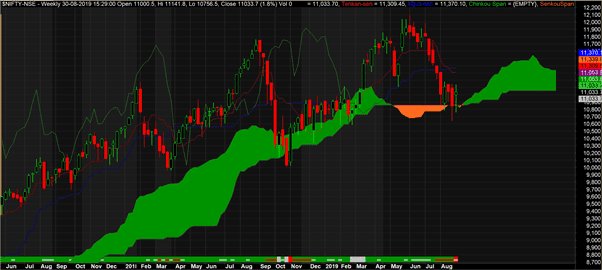
As we mentioned earlier weekly cloud is providing support to Nifty.
However last 4 weeks nifty is trading below an important weekly support line.
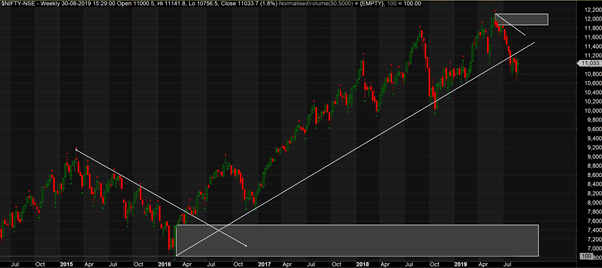
So as per rules, from weekly charts, next demand area for nifty is all the way down to 7,600 levels. And supply area is around 11,800. So on weekly charts, a short trade is visible with target of 7,600 and SL above 12,200. Profit of 3,400 and SL of 1,200. Its not wise to expect such a large crash, but its possible given the past data.
Lets look at past corrections on Nifty.
Nifty PE ratios
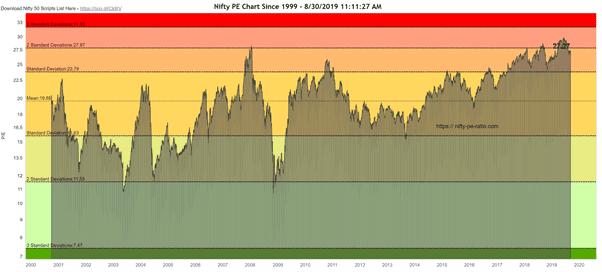
Since 2000 Nifty has traded above 2nd deviation on PE chart only before 2008 crash where we moved from +2rd deviation to -2nd deviation. Then we corrected from a high of 6350 to a low of below 2350. That is correction of 63%.
Oct 2011 Nifty was at +2 SD and came down to -1 SD in Dec 2011. Correction from 6340 to 4530. Correction of 28%
A recent correction in March 2015 saw Nifty move from 9120 to 6825. A correction of about 25%. In this correction we moved PE from 1st SD to mean value.
Since PE ratio moves in oscillation, we see less number of buyers in market which results in a correction. Now even if we have to go down to around 1st SD, PE ratio will be around 23.8 compared to current 27.27. If we do not have major earnings growth (given current economy this is unlikely) we are talking about 9,600 levels which is around 20% of correction from a top. And mean is at 19.65 which suggests 7930 or a correction of about 33% from the top.
Another important point to note from PE chart is that when PE ratio starts moving up from mean, in about 1 years it records high and within next 1 year it comes down to mean again.
This time around we crossed mean in PE ratio in Mar 2016 and since then for more than 3.5 years we have not come down to mean.
Do we really have one of the best economic indicators compared to past within and outside of India at this point in time to justify such a high PE? I am not sure.
Nifty Daily
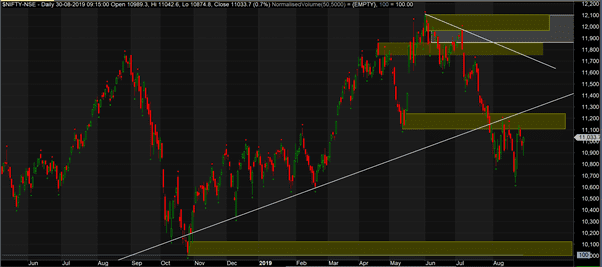
On daily charts we are clearly below the supply zone and tested that 2 times and could not cross the zone. Given this a very likely correction at least to 10,100 is in place. SL for this trade is above 11,250 around. As I mentioned on 17 Aug, this correction may not be a sharp correction and market may go sideways before coming down.
Gold
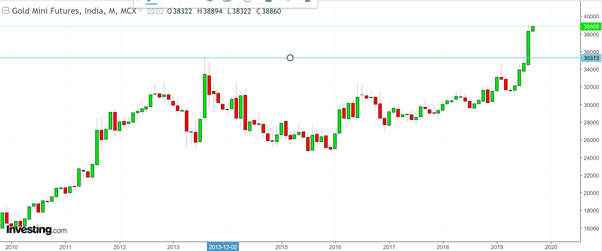
Gold has broken all time high after Aug 2013 (6 years) and immediately moved another 8% plus. Most of the times gold and equity go opposite to each other.
Final Take
Nifty looks very weak at this moment except for the weekly cloud support. If those clouds are broken we will see levels of 10,100 and below (To be evaluated around 10,100 levels).
We recommend long term investors to be cautious and to book partial profit or at least hedge their positions. New capital can be deployed only above 11,250 levels (only for high risk investors). Low risk investors to wait for all time high to be broken or a good correction of 20% or more.
Sir, Keep it up for such simple to understand detail analysis which become lighthouse for my kind of investor. Looking forward for such post atleast once a fortnight and when there is change in key indicator (for investor not trader) to guide us to invest in the market for long term (more than 48 to 60 months). Though i follow on twitter lately i did not get any of your tweet alert during last months.
Thanks for nice words. You may follow me on twitter @MilindAPol and you will get alerts for this and more.