This is an effort to do a detailed top down analysis on Crude. Have taken US Crude as it has a lot of data. USD is stable currency hence the chart should have a good structure.
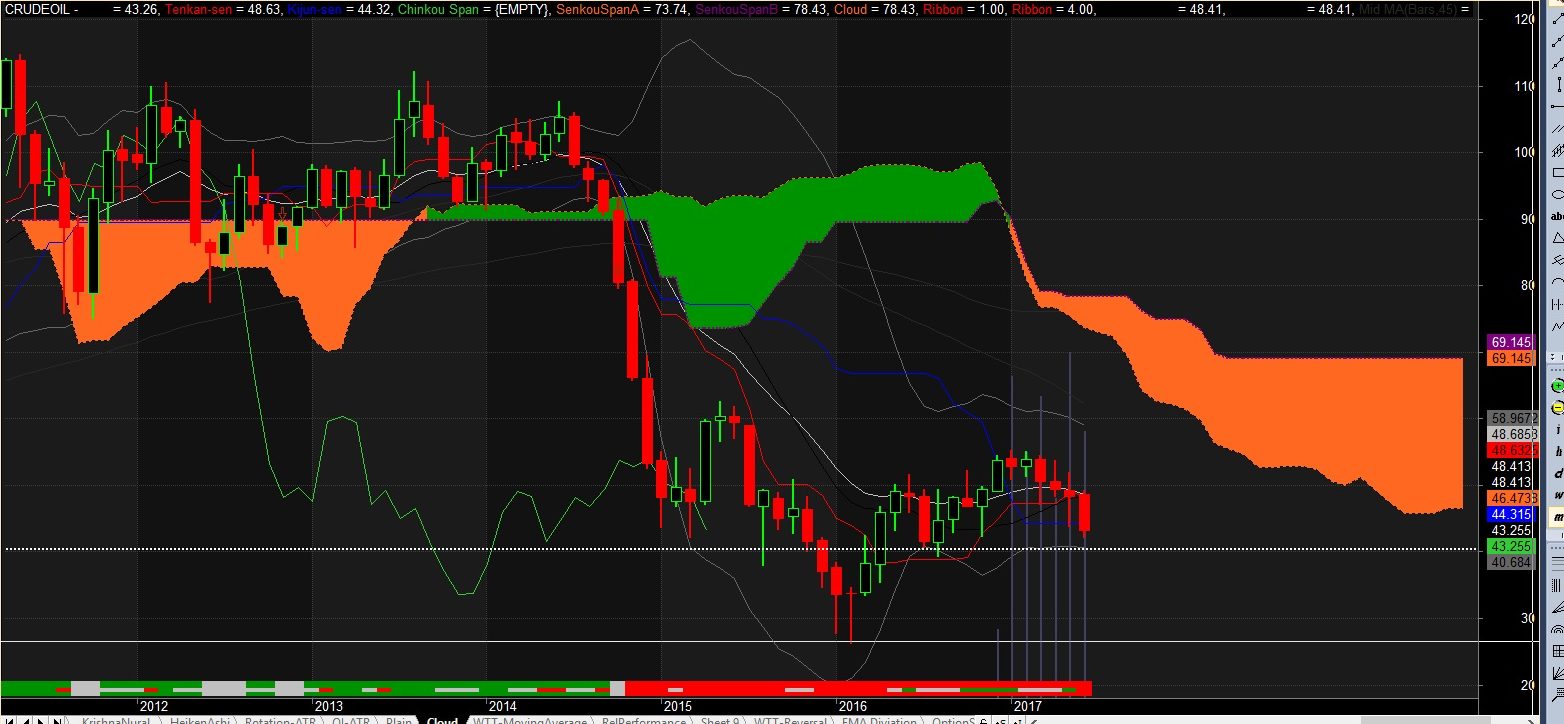
Analysis of Quarterly chart
From low of about $ 10.4 in 1998, crude has shown a unidirectional move to about $150 in 2008. That is 15 times in 10 years (If you owned $100 worth of crude, it would have become $1500. And in just 2 quarters it came down to about $32. If you would have gone short at $150 with about 20% capital requirement, (about $30) you would have made about $120. That is 4 times in just about 6 months. Similarly, those who might have gone wrong with their position, would have lost as much without proper SL in place.
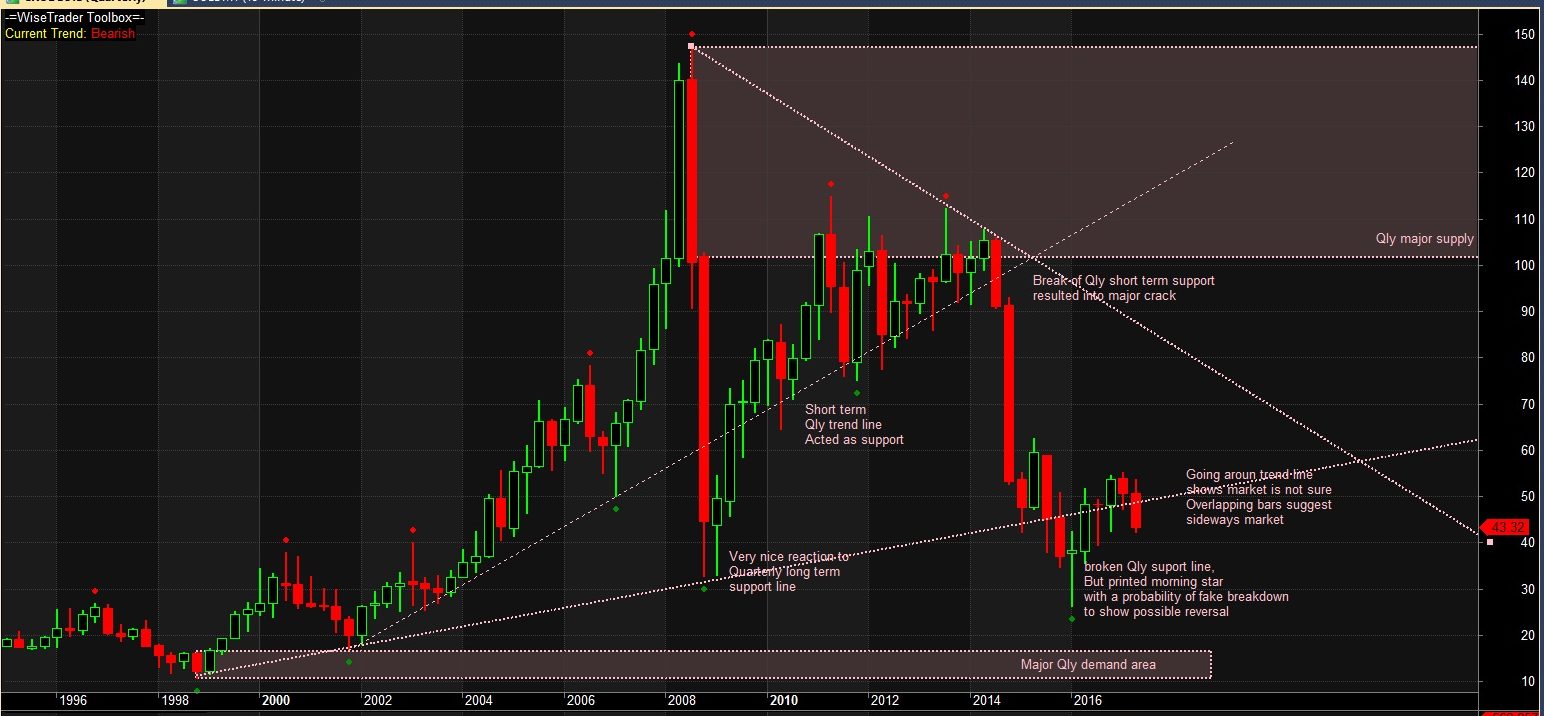
This $32 was also is on long term support line. and then promptly move above short term support line and held this support line till half of 2014. A move from $32 to $110 again about 4-5 times in 6 years.
Then it broke the support line to have another massive fall to $26.6 from $107. That is $80 fall in 7 Quarters till march 2016. In this fall, it showed some reaction to our long term support line for one quarter.
From March 2016, it printed a morning star giving an indication that it wants to now change the direction. However the price action is mostly sideways. Since that time every Q it has managed to close above our long term support line… This is one of the important points to note if you are going to plan to trade crude. Current Qly bar will end Aug 2017. Question is, will it manage to close above this support line (that is above $48.5)???
Last point to note is that with break of the long term support line, we also have got in a long term resistance line now.
Analysis of Monthly chart
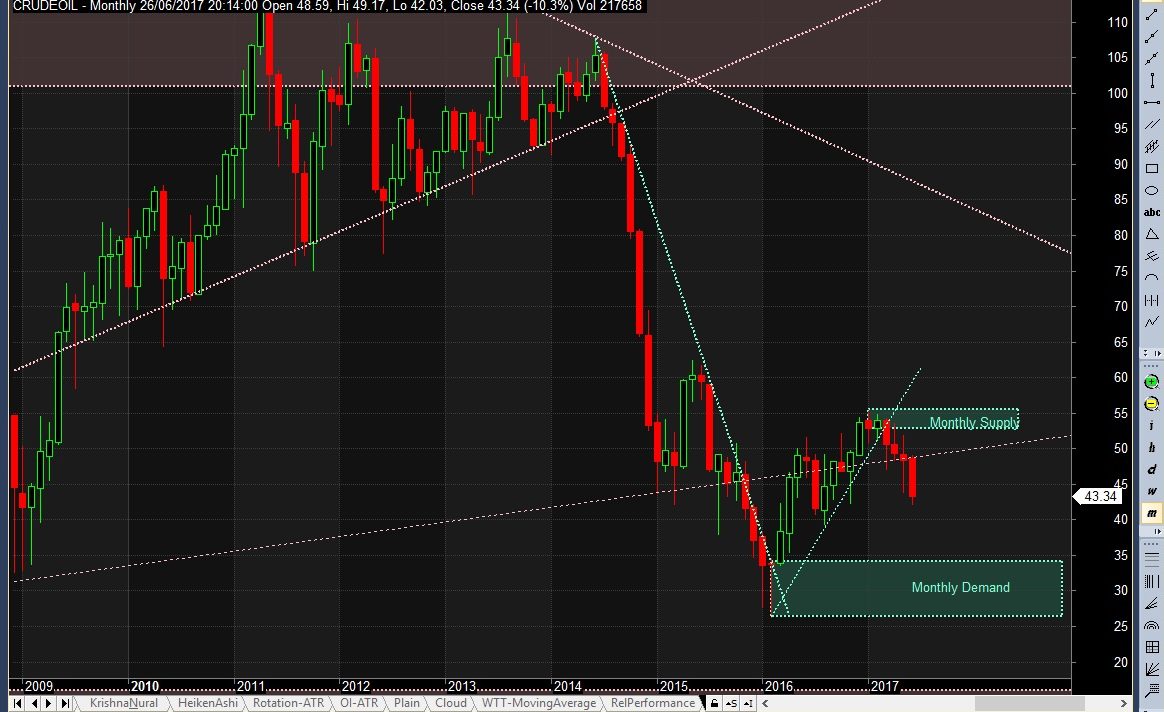
There is not much on monthly chart except for a supply and demand area as mentioned in picture.
Monthly support around 52.5 and demand around 34.4.
Analysis of weekly chart
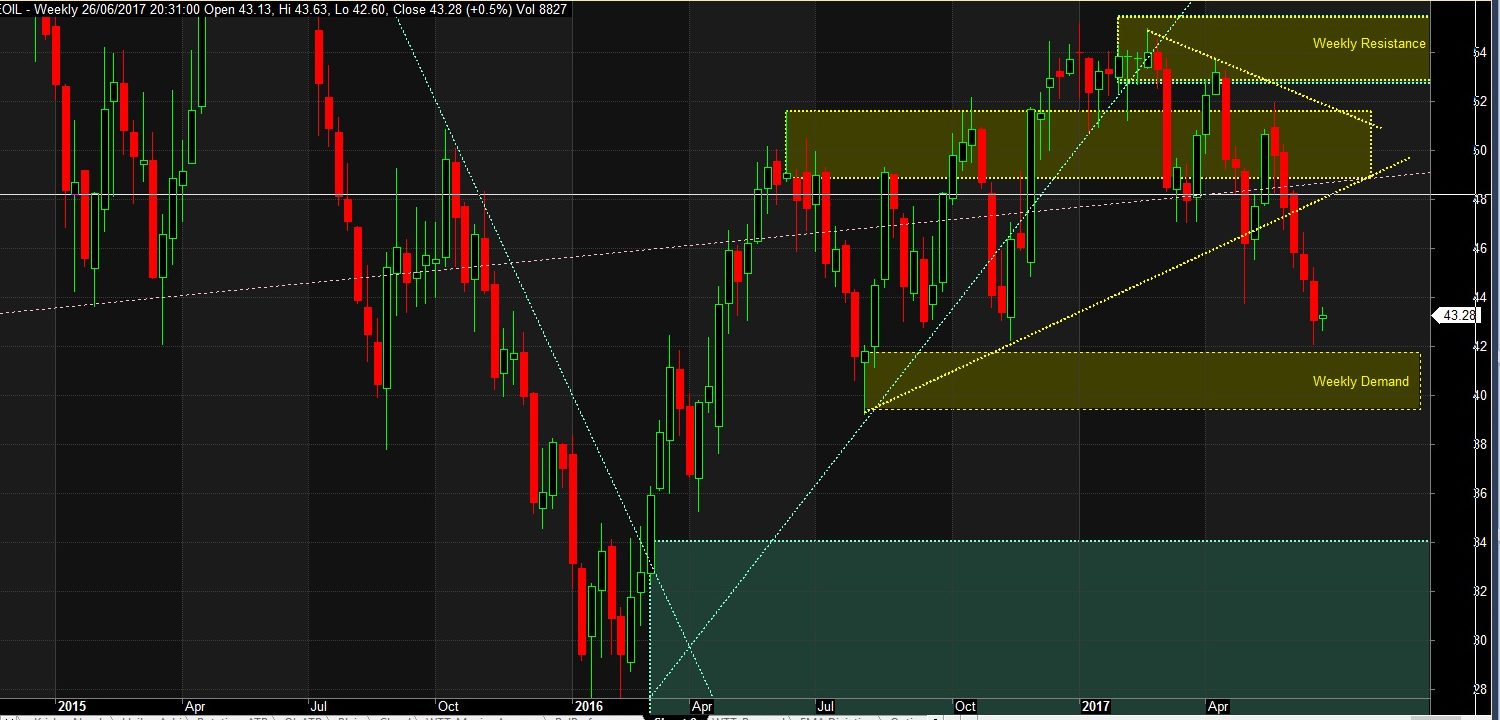
On Weekly chart again we see a nice trend just as in Qly chart. We are currently in a downtrend which seem to be fairly old and trading near weekly demand area of $41.8. Both weekly support and resistance lines are fairly far away. For last 5 weeks we are seeing lower high lower low (also called as one timeframing). These things indicate that there is no good risk to reward to take a trade looking at this timeframe.
Analysis of daily chart
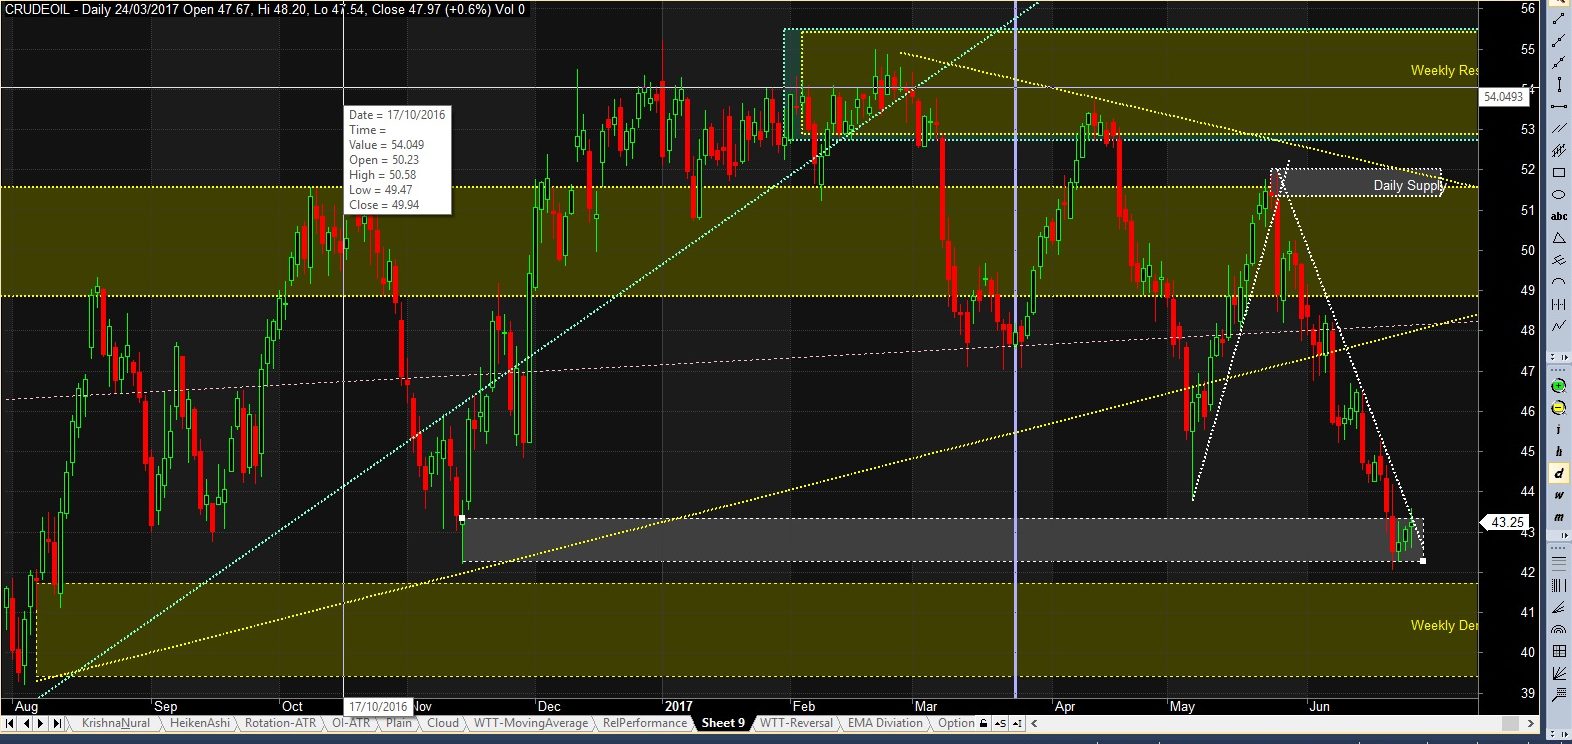
On daily chart, we are on top of demand area with trend still being down. It is not recommended to trend in such a scenario. There is not good risk to reward ratio if one wants to go short looking at the daily trend line as targets both on daily demand and weekly demand areas are very close.
If one wants to evaluate going long, the daily and weekly trend lines are not in favour as they indicate downtrend. net net, we are in no trade position.
And that is when one needs to keep a close eye on the charts to grab right opportunities….
For those who have seen my equity investment video –
https://learn2invest.in/projects/equity-investment-101/
Here are charts of Ichimoku cloud.
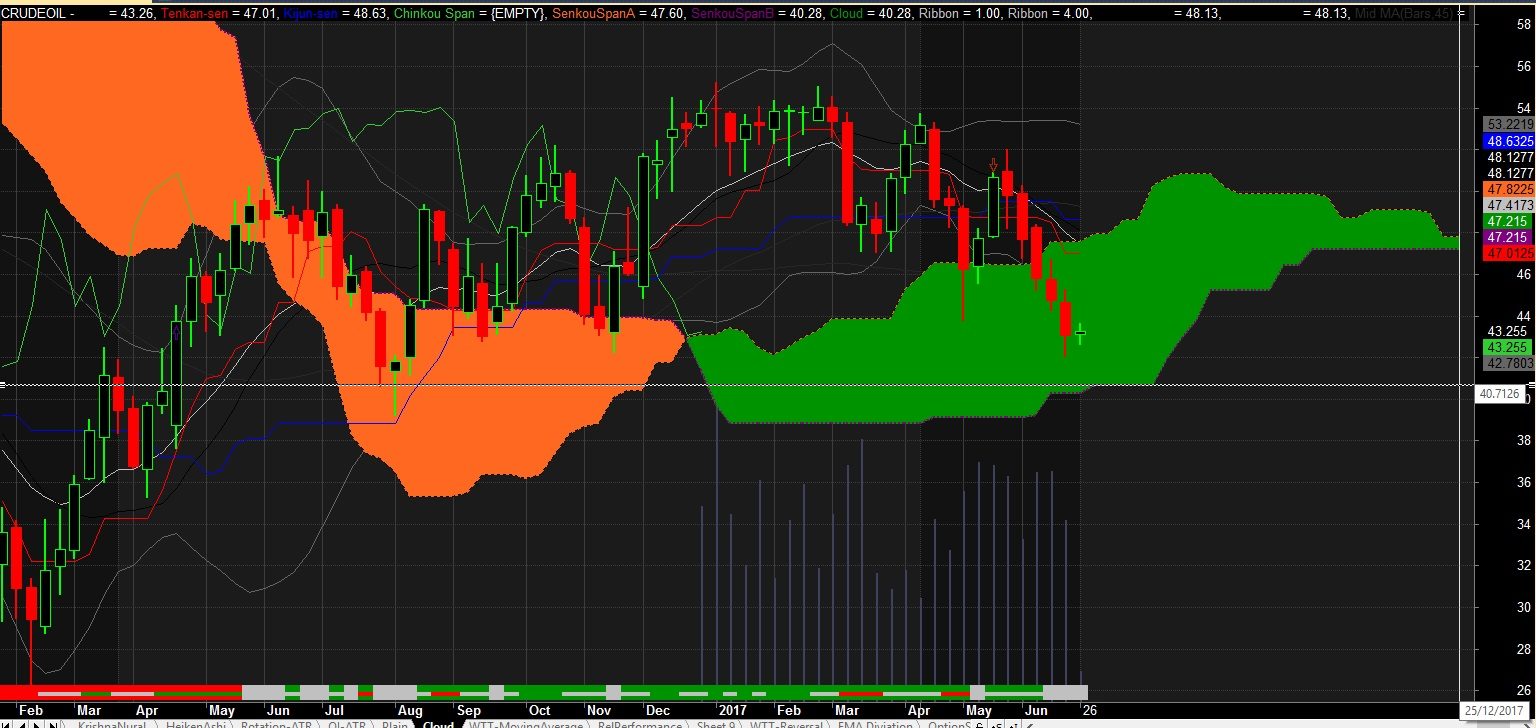
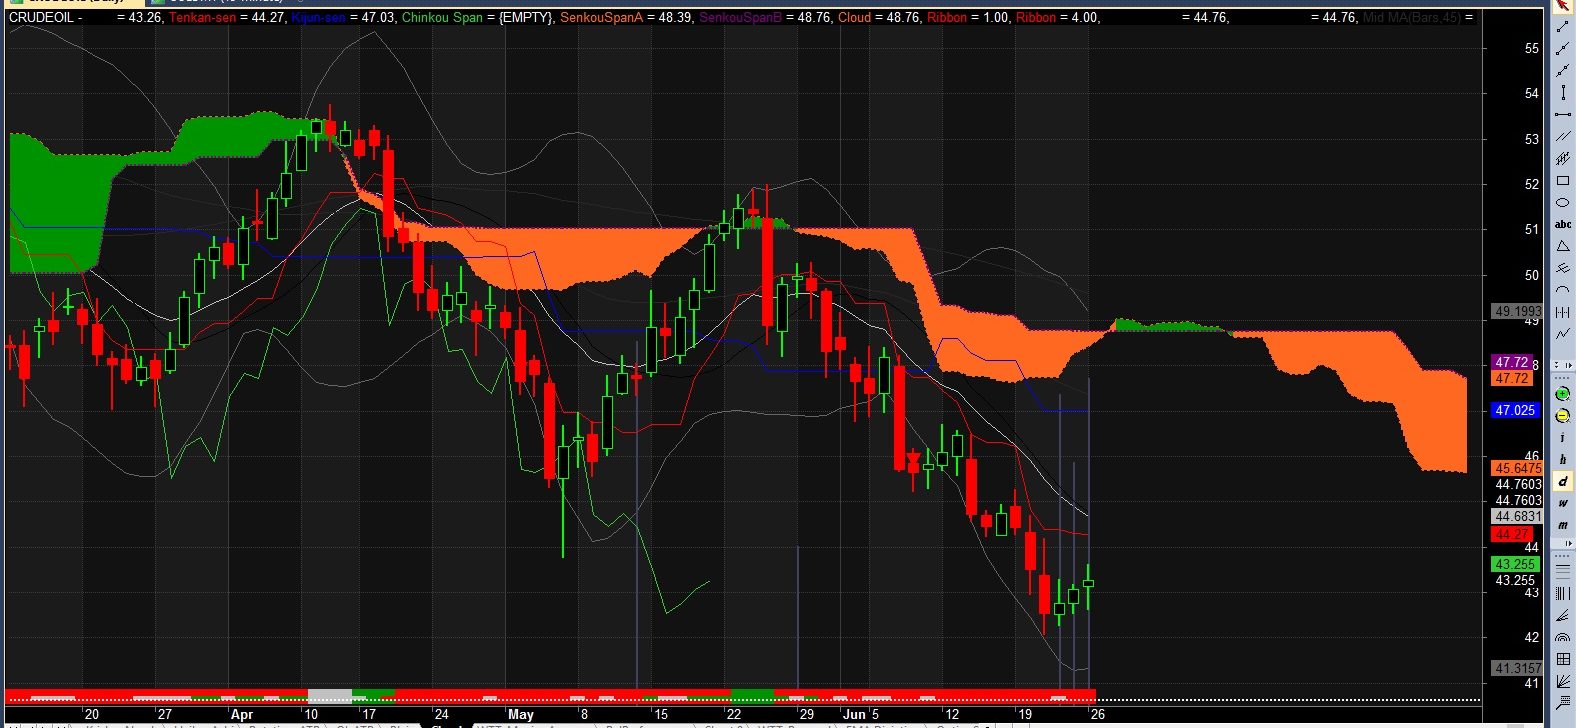
These charts tell same story perhaps in different language… Weekly chart says, we are very close to a flatbed which may act as near term support at $40.7. Daily charts although are suggesting more weakness, bollinger bands suggest a consolidation in near future.
If some one needs expert view regarding running
a blog after that i propose him/her to go to see this blog, Keep up thee pleasant work.
daftar universitas swasta di jakarta
Now Crude has confirmed the upward trend on daily. Target USD 51… Check https://www.facebook.com/AllAboutTradingAndInvesting/ for pictures and more analysis
Milindji request you that the chart u post can be enlarged when we click on them, otherwise we r not able to study for
analysis properly.
Hope u can do the needful
Noted. Will try editing tonight.
Done
I am sure you people are watching the break of daily trend line…. This indicates to be that the downtrend on daily timeframe looks to have ended and we may start going higher…
This baby has shown cool move from 43.3 to 46.8 as of now which is full 8% move!!! if you would have taken leveraged position you needed 20% capital. This would have been more than 40% return!!!
Crude trade using video recording is better option, I feel.
Helpful analysis Milind. Thanks for sharing.