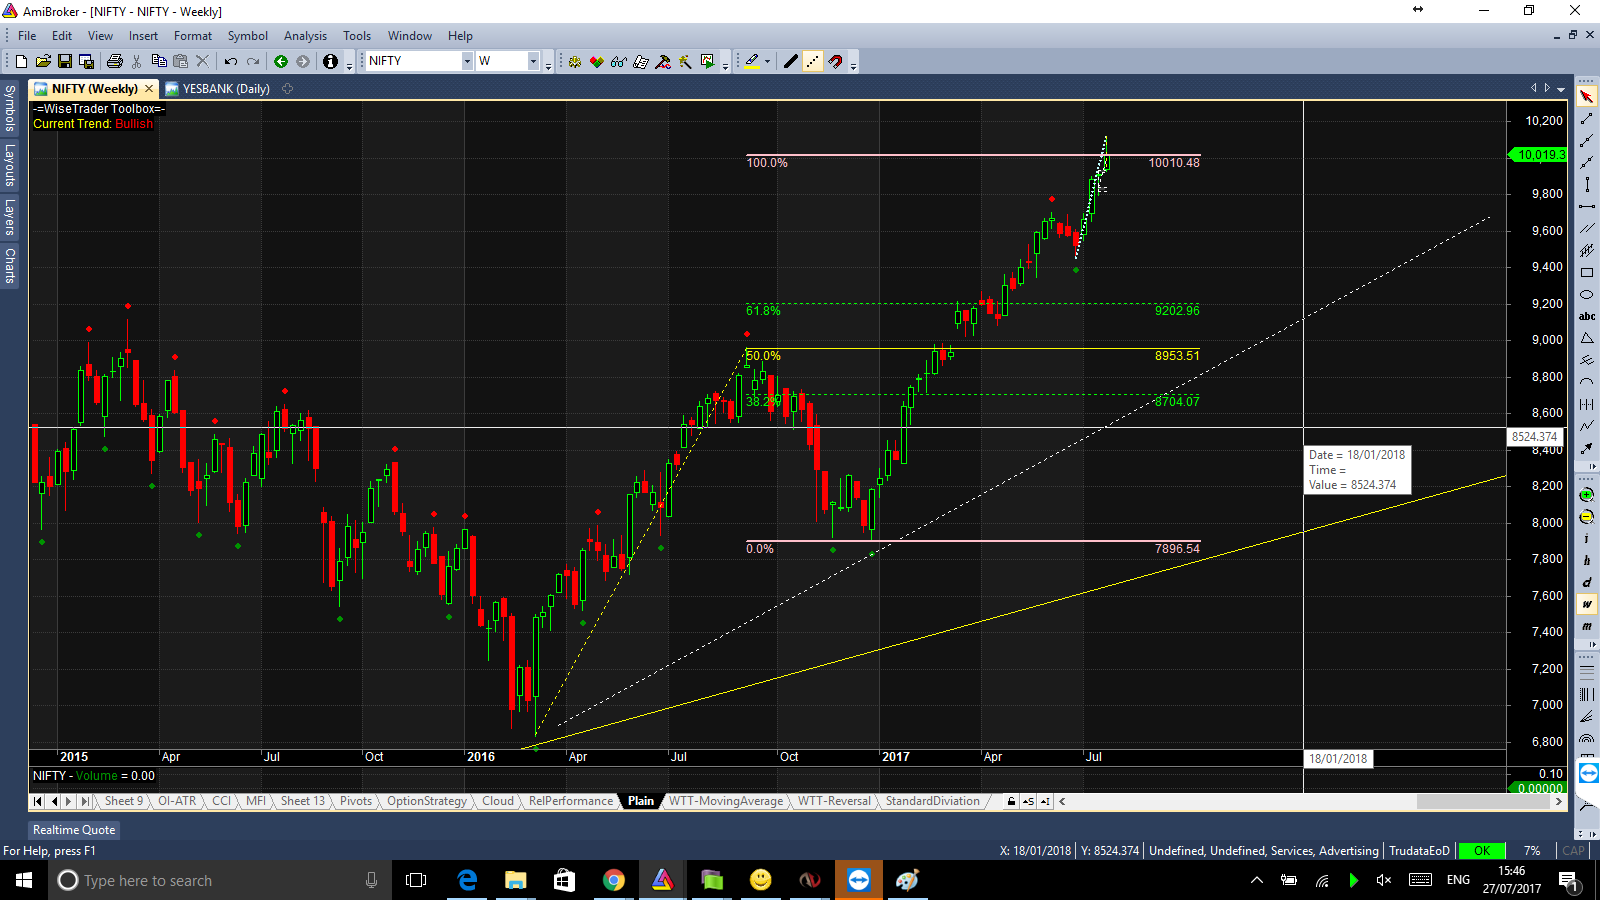
Fibonacci in action???
On Nifty charts, we had a bottom of 6825 and there on had a rally of 2145 points to 8970. From there we corrected exact 50% to 7895. And then 2145 points from 7895 is 10040. Today we tested these levels and corrected. Are we printing an intermediate top?
Make no mistake, a lot of tops are printed on expiry day…
However I am still holding my longs till my system gives me a sell signal below today’s calendar.
Does not look like!!! Nifty is showing good strength by printing close on all time high…