Making money in stock market is easy if you follow our recommended strategies… Here is stock we have been tracking which has given 13 % minimum in 4 months and
In May we talked about one interesting stock – Arvind and to follow the stock which has fairly good chance of break out. It took few months before it gave the break on 8th Aug 2017 @ 390 where we recommended a buy with SL of 350 which happened to be a fake breakout and it reversed one more time. It just gave more and more opportunities for buyers to enter into the stock at lower levels.
These kind of stocks have a long period of distribution where the price goes sideways and then breaks out of the range…
We have discussed cloud and also why this stock gave this buying opportunity is explained in blog – https://learn2invest.in/equity-investment-beginners-india/
So lets look at the supply demand charts for Arvind.
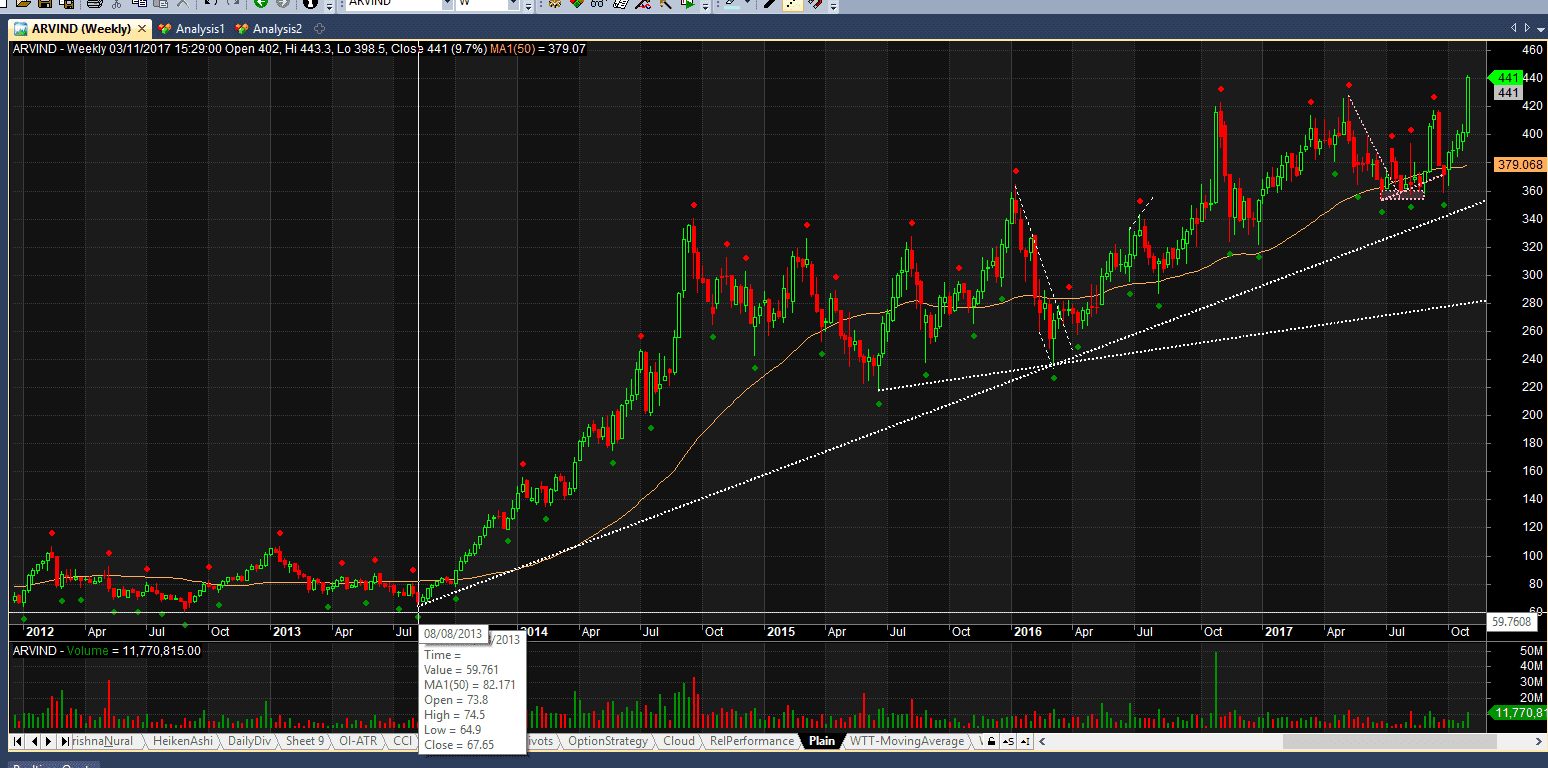
On Weekly charts it clearly in uptrend. March 2016 it had come to this support line at around 240 and today its nearly doubled from there.
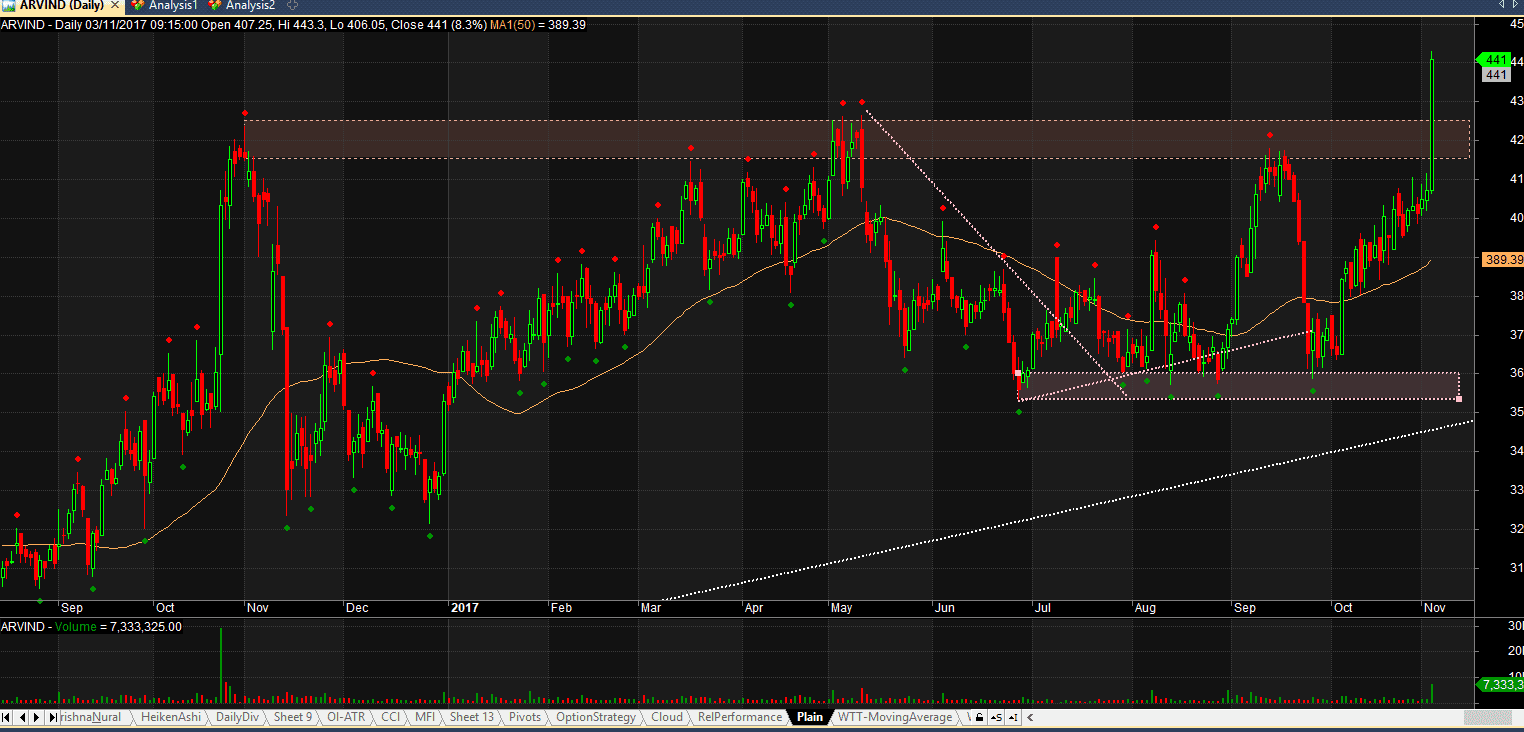
Arvind daily has an interesting sideways move since last year November where it printed high of around 425 and Tested this supply zone twice before breaking it convincingly on Friday. In all probability this becomes a very good demand hence support zone for many more trading days to come. So now our SL is shifted to below friday candle which broke this (around 400 levels)
If you would have bought it at 390 levels in August, you would have made cool 13% in 4 months flat. If you would have tried to get a lower price of 360 around, you would have made about 22% in 4 months. And if this is a genuine brekout, you may find that this becomes a multibager very soon…
There are a lot of such ideas all around. Important thing is to keep tracking and making right decision at right time…