Its too early to say if Nifty has made a top and that it has changed the direction yet.
But Fibonacci followers should be very happy looking at the levels.
Lets start with Monthly Charts –
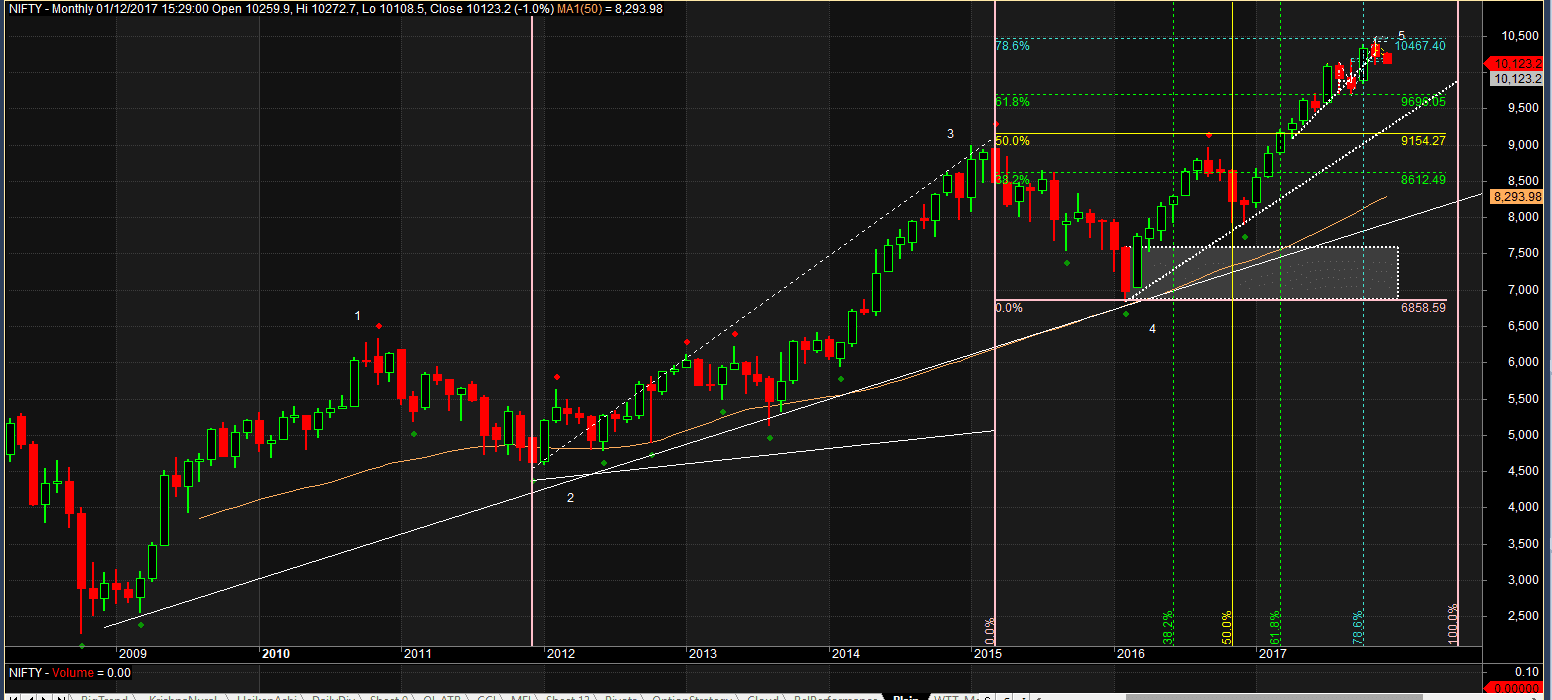
From Supply demand point of view, charts are in very good long side move. If we plot Fibonacci extension, 78.6% move comes to 10,470 Nifty made a high of 10.490 and printed a red bar in November. On time wise, same 78.6% time was spent till Oct 2017 (One bar less). With these numbers coming together, can we say we have done
Lets look at weekly –
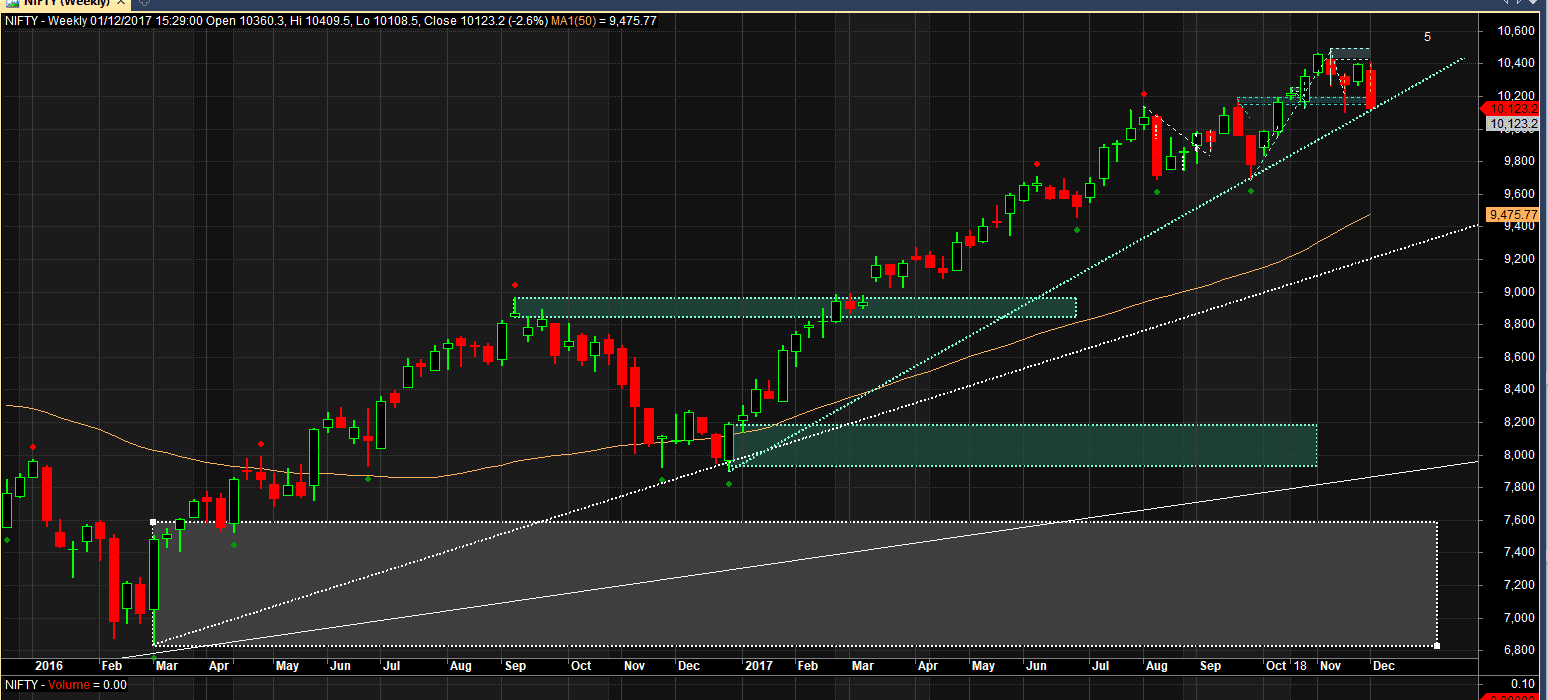
We are right at weekly support line.
Here is the daily view
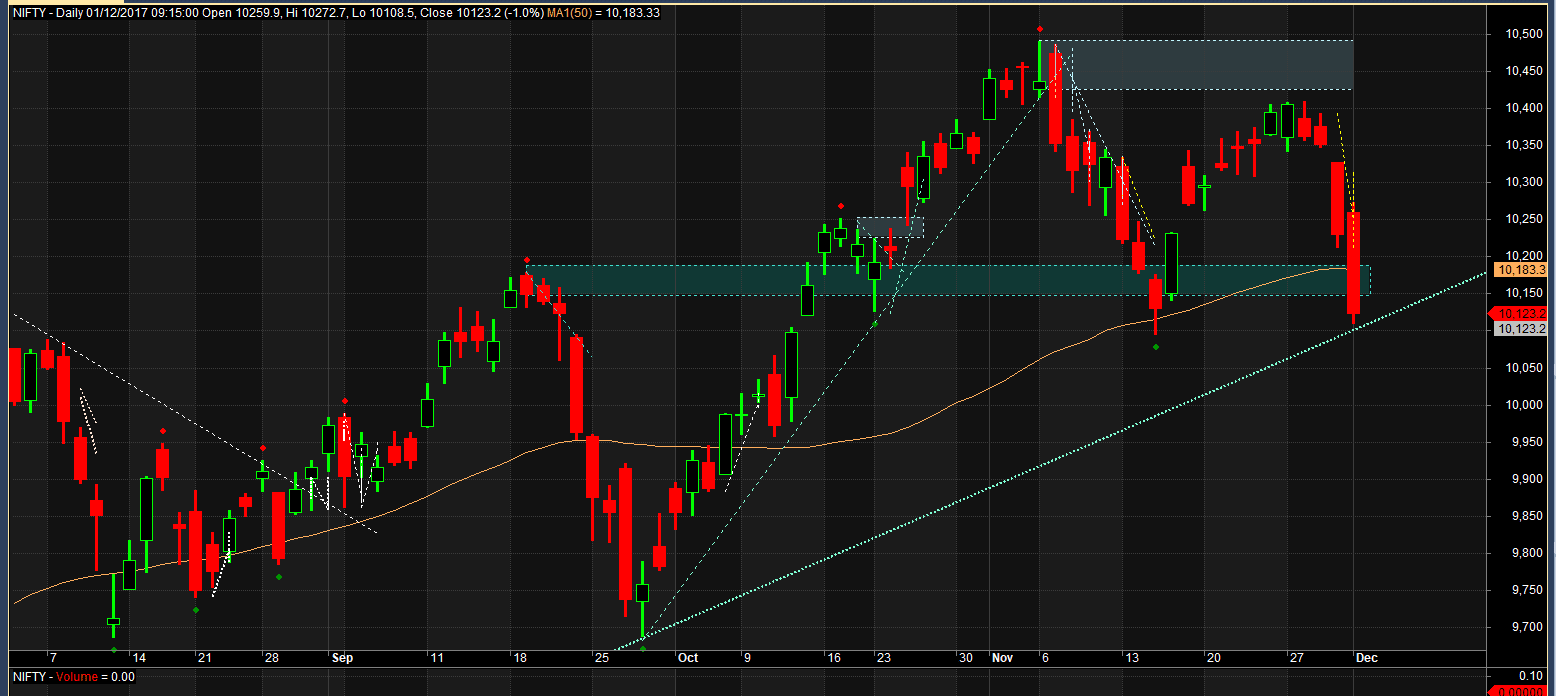
On Daily charts, it has broken support of 10,150. However we will need a followup to this break to call it a successful break of the supply area.
And finally Intraday view
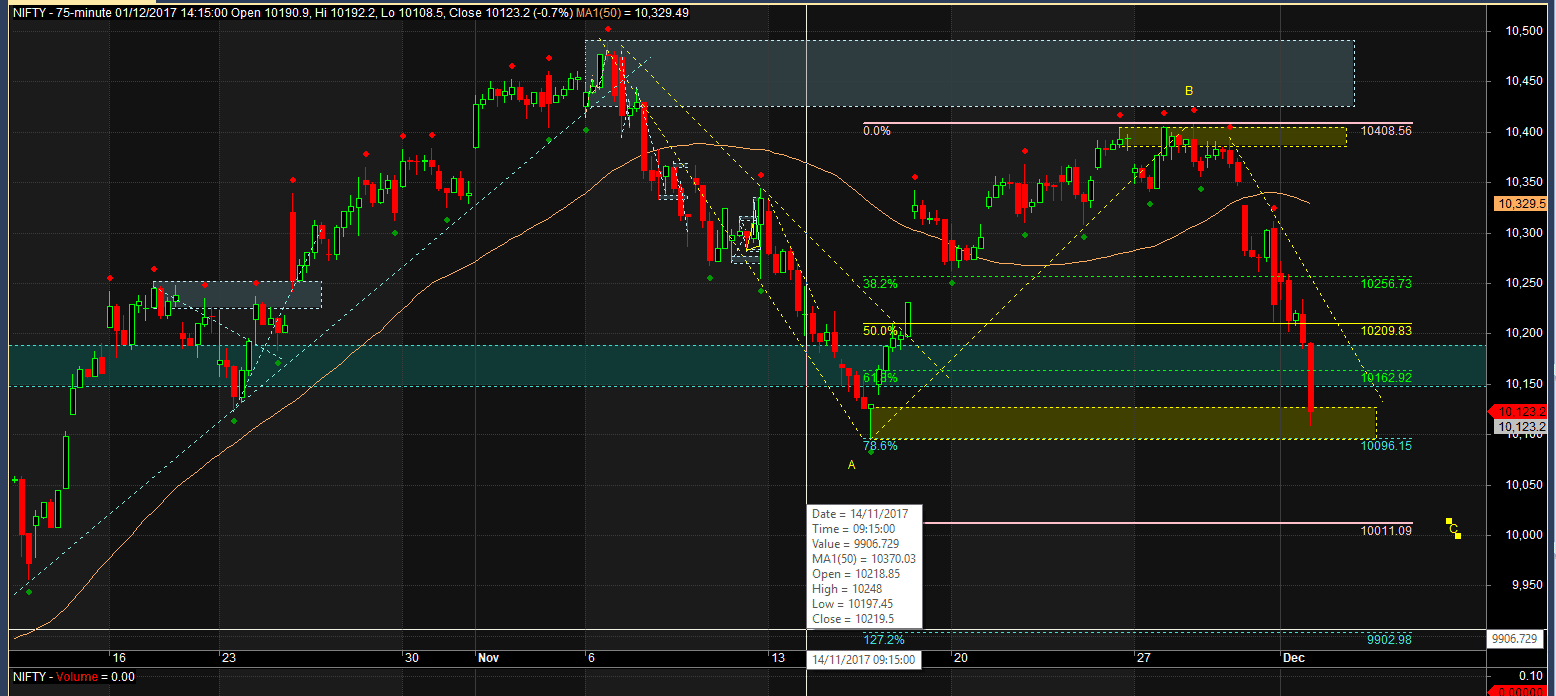
On the intraday charts, we have clearly started downtrend and are right at last times demand area. A break of 10,090 will break this area as well.
If I consider it to be A-B-C correction B has retraced exactly to 78.6%. When B retraces more than 61.8%, high chance that C is 100% or max 127%. So an area between 9900 and 10,000 is where we may find demand coming in.
How does OI look like?
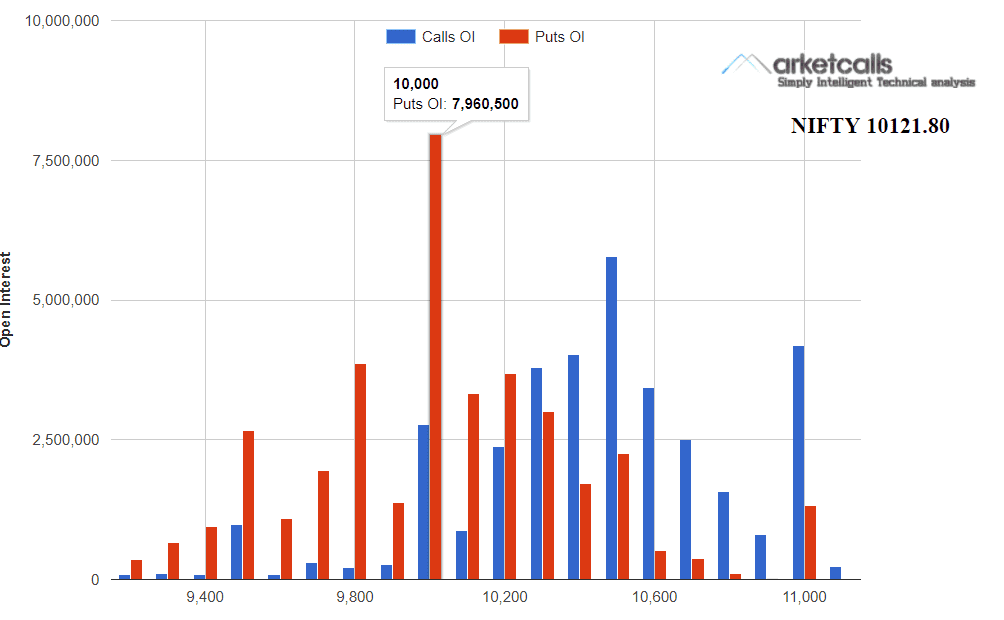
Open interest @ 10,000 makes me believe that there is going to be very good battle between bears and bulls at this level. For Bulls these levels could provide a decent risk to reward ratio to go long.
Most interestingly on Friday (1st December) both DII and FII were net buyers as per NSE site…
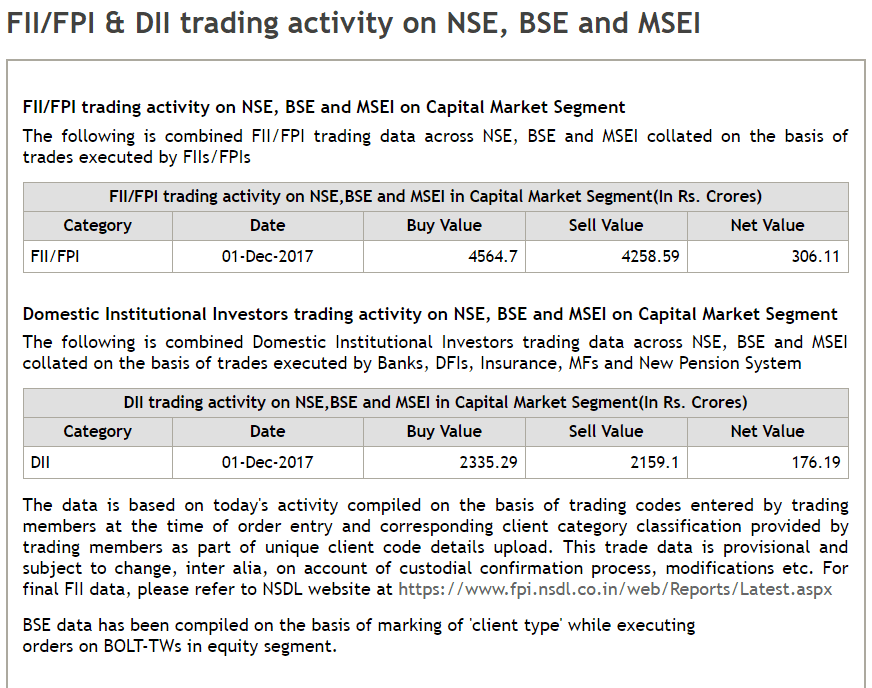
I am not able to explain who had strength to make nifty fall so much while both DII and FII were buying!!! Is it HNI? Is it retail SL getting hit? If that is the case, a case for pull back gets to be more real.
Net net, I want to watch 10,000 levels in Nifty closely. I strongly believe based on above information that we are going to test 10,000 and also may be 9,900 levels soon. But the markets may actually rebound this time around and go up to test 10,500 levels one more time. However if we print a red candle on weekly charts, with levels below 10,000 or 9900, investors should start preparing for exits in their long term portfolio and be ready with cash to deploy at lower levels after 6-12 months.
Stocks who may underperform in coming weeks
You have seen strength of my analysis in bull market when we are able to consistently beat Nifty and also a lot of fund managers. So here today is a list of stocks you should be careful with, if we break these crucial levels. These are stocks who have a habit of under-performing Nifty in long term and have started under-performing on weekly charts.
| Ticker | Relative Strength | Relativestrength SMA | Last Close |
| ACC | -42.64 | -39.51 | 1672.4 |
| AMBUJACEM | -5.21 | -4.25 | 264.15 |
| BATAINDIA | 57.87 | -5.45 | 729 |
| BHARTIARTL | 49.84 | -7.59 | 487.5 |
| CANBK | 15.37 | -26.42 | 362.05 |
| CIPLA | -3.06 | -4.08 | 598 |
| COALINDIA | -12.17 | -20.54 | 272.2 |
| DRREDDY | -292.84 | -32.88 | 2234 |
| IDFC | -0.8 | -4.57 | 61 |
| JPASSOCIAT | -0.5 | -7.91 | 17.8 |
| KTKBANK | -2.1 | -2.04 | 153 |
| ONGC | -2.48 | -9.23 | 180 |
| PFC | -9.43 | -2.09 | 119.4 |
| PNB | 15.89 | -8.16 | 170.3 |
| PTC | 3.72 | -0.54 | 115.6 |
| RCOM | -10.19 | -5.97 | 12.3 |
| RECLTD | -12.62 | -1.5 | 153.8 |
| RELCAPITAL | -145.07 | -6.72 | 418.75 |
| RELINFRA | -66.1 | -23.29 | 435.9 |
| TATAMOTORS | -36.43 | -2.24 | 399 |
| TATASTEEL | 62.58 | -7.23 | 680.55 |
| VEDL | 7.38 | -2.43 | 286 |
| WIPRO | 0.5 | -3.42 | 289 |
nice very nice