We strongly believe that the correction is not yet over. However we are continuously getting requests on one stock or the other asking if one can invest in those.
In this scenario when Nifty is going through a correction, it is not a good time to use relative strength and to buy stocks as those investments may still correct but not as much as nifty and they may be relatively strong.
We know that every correction in Indian market so far has eventually got over and buying at the time of correction has given good results.
Review of 2000 Correction
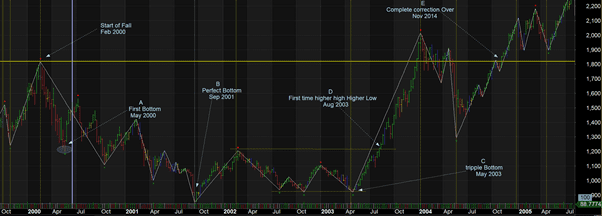
Correction Started in Feb 2000 and eventually got over in Nov 2004 after about 3.8 years. In my last blog I have given more details about correction. Here we are talking about possible places where one can invest.
We believe catching perfect bottom is impossible (Point B on chart) . But there are always reversal patterns First such reversal pattern happened in May of 2003 Point C on chart) with a triple (or may be double) bottom. Even if someone missed that bottom, he/she could use dow theory and buy after we get higher high and higher bottom in Aug 2003 (Point D on chart). An extremely defensive person will buy when whole correction is over around Nov 2014 (Point E on chart)
For comparison sake, lets take a horizon of about 10 years for the investor from start of fall that is Feb 2010. And we are currently around the first drop (point A on chart above)
| Point | When | Date | Nifty Price | Duration | Price Feb 2010 | % gain | CAGR |
| 0 | Start of Fall | Feb 2000 | 1,818 | 10 | 4,990 | 174.5% | 10.62% |
| A | First correction bottom | May 2000 | 1,280 | 9.8 | 4,990 | 289.8% | 14.89% |
| B | Perfect bottom | Sep 2001 | 850 | 8.4 | 4,990 | 487.1% | 23.46% |
| C | Tripple bottom | May 2003 | 950 | 6.8 | 4,990 | 425.3% | 27.63% |
| D | Dow Theory | Aug 2003 | 1,205 | 6.5 | 4,990 | 314.1% | 24.43% |
| E | Correction over | Nov 2004 | 1,850 | 5.3 | 4,990 | 169.7% | 20.59% |
If you are happy beating 7% FD return over a long period of time, you need not exit your long positions in Nifty and you could keep adding any time. The best CAGR you get is not at perfect bottom but first turnaround signal of triple bottom, followed by dow theory on weekly charts. Even if you completely skip the whole correction phase, your returns CAGR is comparable to capturing perfect bottom…
Buying after first drop does not make much sense.
Review of 2008 Correction
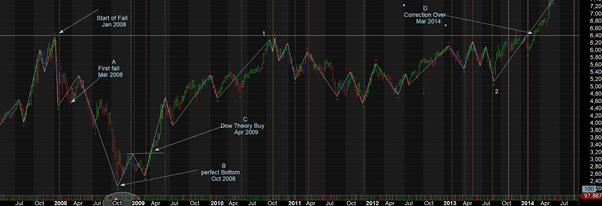
In 2008 correction we did not see any reversal chart pattern. Doing same analysis as 2000, we get following table.
| Point | When | Date | Nifty Price | Duration | Price Feb 2010 | % gain | CAGR |
| 0 | Start of Fall | Jan 2008 | 6,350 | 10 | 10,380 | 63.5% | 5.04% |
| A | First correction bottom | March 2008 | 4,470 | 9.8 | 10,380 | 132.2% | 8.98% |
| B | Perfect bottom | Oct 2008 | 2,250 | 9.3 | 10,380 | 361.3% | 17.87% |
| C | Dow Theory | Apr 2009 | 3,150 | 8.8 | 10,380 | 229.5% | 14.51% |
| D | Correction over | Mar 2014 | 6,538 | 3.8 | 10,380 | 58.8% | 12.94% |
This correction was not as good as 2000 correction in terms of post correction results. And Dow theory was best performing after perfect bottom (which is nearly impossible)
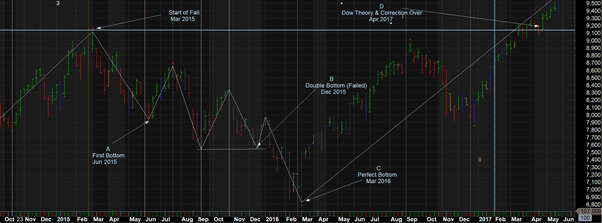
Review of 2015 Correction
Here we compare returns to all time high
| Point | When | Date | Nifty Price | Duration | Price Feb 2010 | % gain | CAGR |
| 0 | Start of Fall | Mar 2015 | 9,120 | 4.8 | 12,430 | 36.3% | 6.66% |
| A | First correction bottom | June 2015 | 7,940 | 4.6 | 12,430 | 56.5% | 10.23% |
| B | Perfect bottom | Mar 2016 | 6,825 | 3.8 | 12,430 | 82.1% | 17.09% |
| C | False Double bottom | Dec 2015 | 7,550 | 4.1 | 12,430 | 64.6% | 12.93% |
| D | Correction over | Apr 2017 | 9,270 | 2.8 | 12,430 | 34.1% | 11.04% |
Returns are similar to 2008 correction. This correction had a double bottom which did not hold. and Dow theory buy came only when the correction got over.
So what should be the plan for 2020 correction?
2020 correction seems to be deeper and my need a long time before markets complete the correction. Hence, we do not recommend any investments at this time, Rather we recommend to exit investments if you see a rally.
Are there still some good stocks to buy? How to identify them
We have answered this question on this video already – https://youtu.be/BiS_Kqq0nhg
Here for this analysis we are going to skip Pivot levels (your homework) and cover Some Sample stocks.
Important: These are potential stocks only, we don’t recommend any buy at this time. Please review the video before you make your decision…
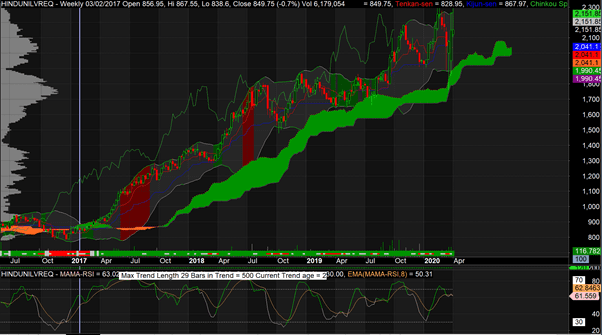
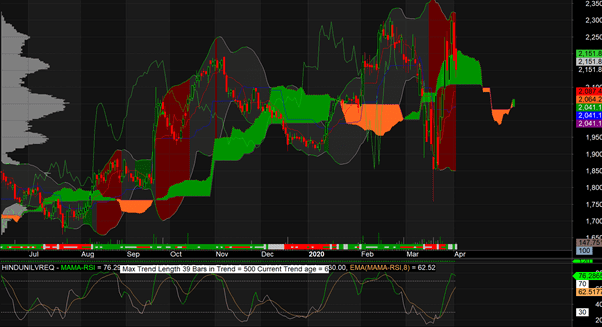
Hindustan Unilever
For extra brave, this could be bought around these levels.
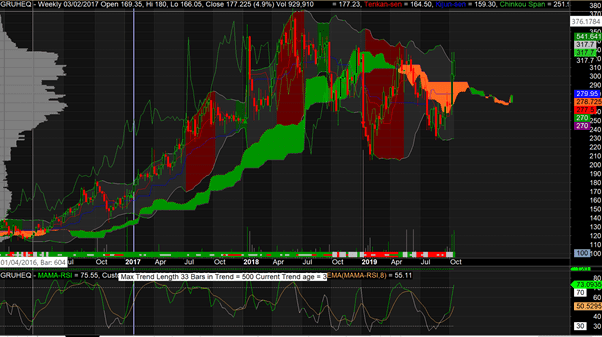
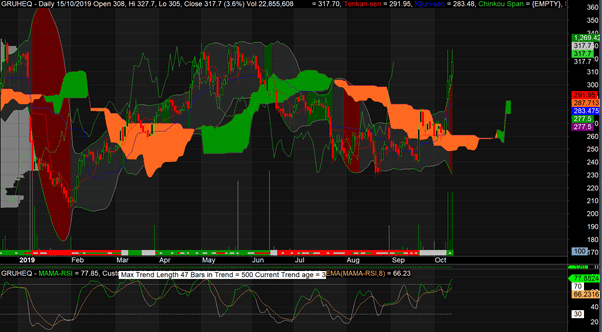
Gruh Finance
This is another decent bet at this point in time
Few more stocks worth to keep in watch list (Not yet triggered for buy)
- Asian Paint
- Bharti Airtel
- Biocon
- Dabur
- Divis Labs
- Dr Reddy
- Escorts
- Granules
- JublFood
- MCX
- Nestle India
- Pidilite
- SRF
- Torent Pharma
- IGL
- IPCALABs
Good insight on stock cycle pattern
Thanks a lot. Good that you like it…