This time, I don’t have a very good news for you and I really wish that my followers did got a chance to exit on my repeated warnings (on my Youtube coming on 2nd March giving you possibility to exit around 11,400 till 5th march.)
We expect a deep correction taking Nifty to a level between 5,200 to 4,000 levels. High probability date for this correction to be over is 27 Oct 2020. Second probable to be Sep/Oct 2021.
This is a long post and the topics are extremely complex to learn. I have tried my best to make it simple.
Here is Video that goes with the Blog –
Background
Effort of all our blogs and videos is to help you learn how to best do analysis for yourself rather than giving specific levels. Today we use some of Gann most important theories that history repeats itself. Gann mentioned that markets work in cycles and if you are able to identify right cycle, you will be able to predict future better than anyone else.
If you want to do more research in this area, I strongly recommend you to learn about fractals. I may do a separate blog on this but not for today.
So where are we in this cycle?
The best way to understand cycles is Elliot waves. Elliot waves say markets move in 1-2-3-4-5 (aggressive trend) followed by A-B-B (corrective trend) and it can be fractals
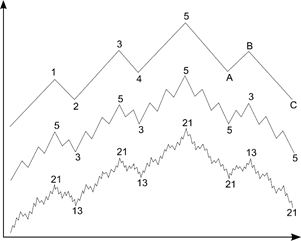
ref: https://commons.wikimedia.org/wiki/File:Elliott_wave.svg#/media/File:Elliott_wave.svg
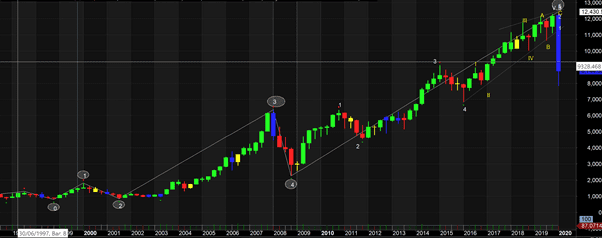
On this Video – https://youtu.be/kkFcV-IYz6E – we clearly mentioned that a huge selloff was expected… In the same video we sowed our Elliot counts.
As per this chart, we are going to expect a correction for the whole 1-2-3-4-5 level. And a correction of 50% to 61.8% is a very natural correction.
What kind of corrections Nifty goes through historically?
Here are Nifty historical corrections.
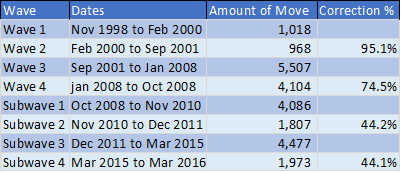
If we Consider 61.8% correction of this whole rally from Nov 1998 to Jan 2020, a Number comes to level of 5,242 for Nifty.
History Repeats Itself…
We don’t have an impulse and correction at this level to compare. The best corrections to compare are wave 2 and wave 4 of previous impulse. This could be a 20 year cycle and repetition of 2000 correction or a 12 year cycle with correction similar to 2008 correction.
Year 2000
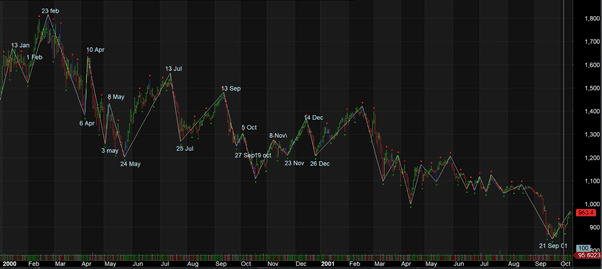
Here are cycles of 2000 correction.
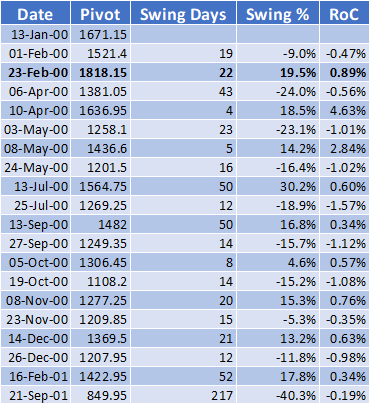
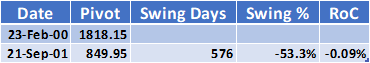
Total Correction –
Notice that maximum Rate of change was between 6 Apr 2000 and 10 Apr 2000 where in 4 days markets moved + 18.5%. maximum fall rate was between 13 Jul to 25 Jul where markets moved -18.9% in 12 days.
Year 2008
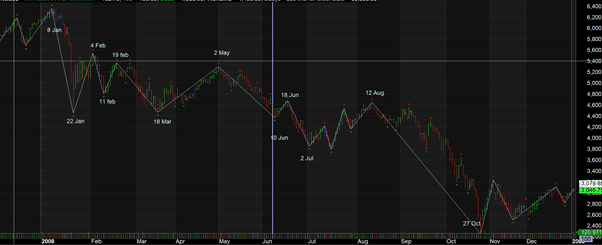
Here are the levels
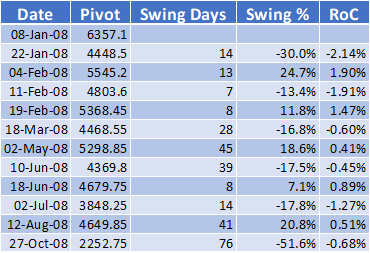
Total Correction
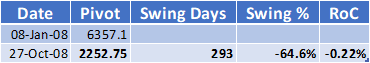
This correction did not have too many ups and downs and maximum positive rate of change was between 22 Jan to 4th Feb when markets moved 24.7% in 13 days. And on negative side it was between 8 Jan to 22 Jan where markets moved 30% in 14 days.
Year 2020
Lets Compare that to Year 2020.
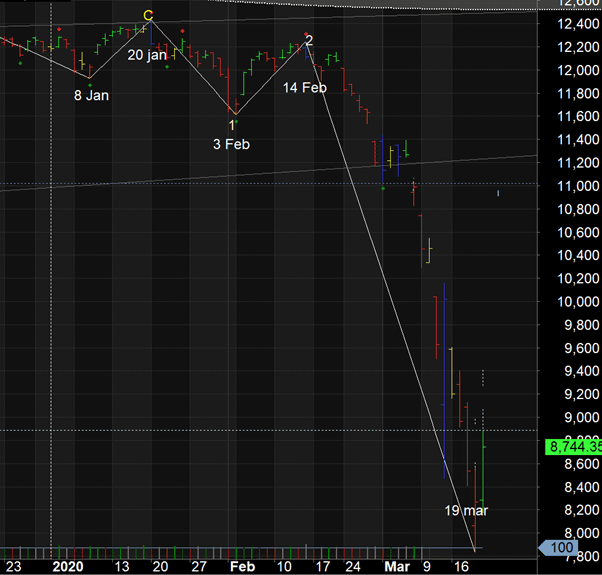
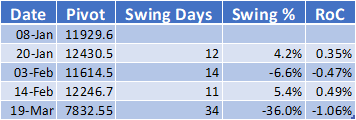
Total drop from 12430 to 7832 is 37%. If you compare the swing drop, this time we have seen 37% of drop compared to max of 30% in 2008. However the last swing drop (14 Feb to 19 mar) of 36% has taken 34 days. At 1.06% a day average drop is nothing compared to 2.14% a day drop in Jan 2008 or 4.63% a day rise in April 2000.
So far this looks to be comparable, but little deeper than 2000 or 2008 correction.
Another interesting thing to observe is dates when the markets turned. Gann has written a lot about circular nature of markets. Let me put together only these turning points for comparison. (I am assuming 19th March 2020 is a turning point although we still don’t have enough evidence)
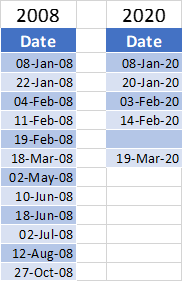
Only date which is not mentioned here is 19th Feb and if you look at the chart closely, that was the date when internal wave 2 finished and this major fall started.
This resemblance is not black magic. It was observed by Gann nearly 100 years back and a lot of people use it in their analysis. On many whats app groups after opening gap down, I had mentioned that 19th March will mark an intermittent bottom.
Would you like to use the dates from 2008 as a guidance for next turn around dates?
Both year 2000 and year 2008 corrections were A-B-C corrections.
Lets assume we are on 20 years cycle and repeating what happened in 2000
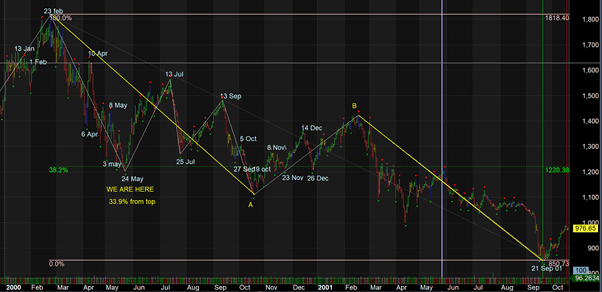
In 2020, we are at 36% correction and had nearly one way down move without any pull backs. So I compare 19 march to 24 may where market corrected around 33.9%. If our comparison is correct, in 2000 down move by 24 may about 62.8% move was complete and only additional 38.2% downmove happened.
Correction to 19 March has been 4,597 points. If this is 62.8% then another 2,724 points correction is expected. This will make complete correction to be around 7321 points. And it takes Nifty to around 5108.
Please also note that for a fairly long time in this correction, markets did a lof of ups and downs.
Lets assume we are on 12 years cycle and repeating what happened in 2008
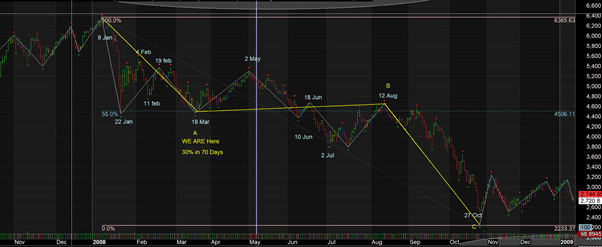
Compared to 2020 37% in about 59 days, in 2008 we have seen first down move of about 30% in 70 days. As we have seen earlier our dates match like a magic between 2008 and 2020.
Correction to 19 March has been 4,597 points. If this is 45% then another 3762 points correction is expected. This will make complete correction to be around 8360 points. And it takes Nifty to around 4070.
Little bit on Fundamental Analysis
On Friday 20th march SEBI has brought in controls for short selling and also tightened limits on FnO. We believe that is going to arrest the massive downfall we have seen in recent times.
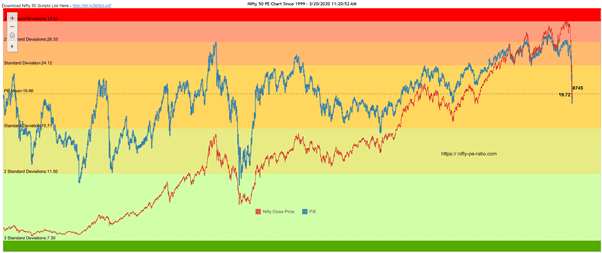
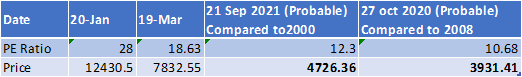
When we look at PE charts for Nifty, on 19 march Nifty PE ratio was 18.63. and on 20th Jan it was 28 when we had a peak. That is fall of 4597 points in 9.37 points in PE ratio. Extrapolating it to 2000 and 2008 scenarios we get following possible values of Nifty:
There is a possibility of Earnings getting impacted and to reduce that impact we have taken PE values of those corrections rather than using Standard deviation. Second standard deviation on the other side stands at 11.5 which has been visited 3 times in past. With 11.5 PE ratio, Infy target comes to 4,333.
I am not an expert fundamental analyst and don’t want to become one when my charts work excellent. The idea here is only to get a guidance that chart readings shown are possible from fundamental point of view.
Final Picture
The expected levels with probable dates is as following. We expect a correction to wipe out gains of last about 10-12 years from markets and to take us to a level between 4,000 and 5,200. Following monthly chart shows what is possible.
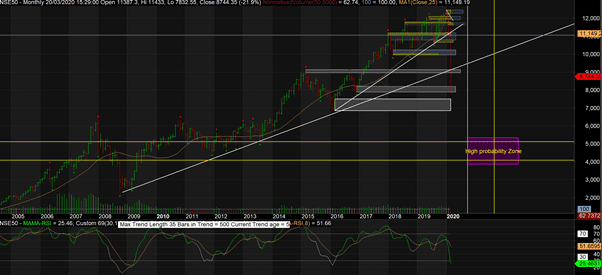
We do expect a rally from here on. It will be furious and may feel as if bottom is in place. Don’t get fooled with it. Use it to exit your longs. This rally has a potential of going upto 9,500 to 10,000 levels.