If You have been following me, you would have been a perfect position today. We have been talking about a possible major crash all the way from Nov 2019. In February 2020 we were probably the first to say that major crash is coming. On March 02 gave final confirmation for a possible fall and retweeted it on March 06 – https://twitter.com/MilindAPol/status/1235700890415194113?s=20
As per Gann analysis we expect an intermittent bottom to be made of about 6,900 around 22 Jun. and next immediate stop around 7900. Our final Nifty target of 4,100 -5,100 still remains valid targets.
Today we are giving reasons why we expect second selling wave to come with next stop at 7900. This is a perfect chance to exit your portfolio and to create cash to invest at a lower level.
Experienced FnO traders can use this opportunity to go short. We don’t recommend you to get into futures or Options without proper guidance and learning. Please evaluate your risks well.
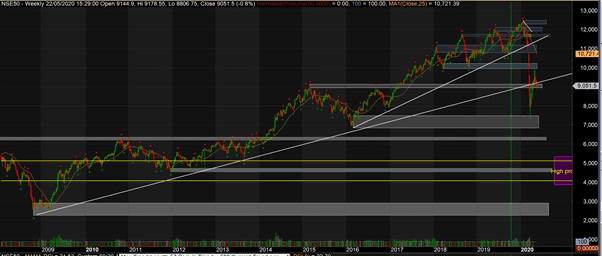
Nifty High level – Weekly –
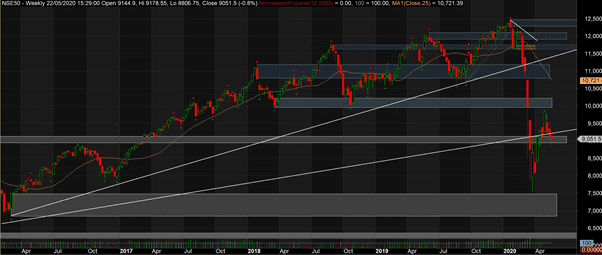
On weekly charts we see a major fall as expected. Observe that we are breaking the major support line. Please refer to next picture for zoomed in details.
On 24 March we tested the demand area around 7500 and bounced back to test another demand area (now supply area) of 9952 to print high of 9889. And now it has successfully broken the long term demand line printing whole candle below it.
Expect next stop at 7500 as there is no long term supply demand line at weekly level.
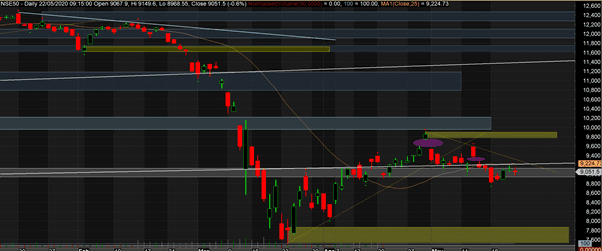
Nifty Daily
On daily charts, next demand area looks to be at around 7900 which is also our next immediate target for this coming fall. For this fall a stop loss level of full weekly candle above the weekly trend line (discussed above) should be best.
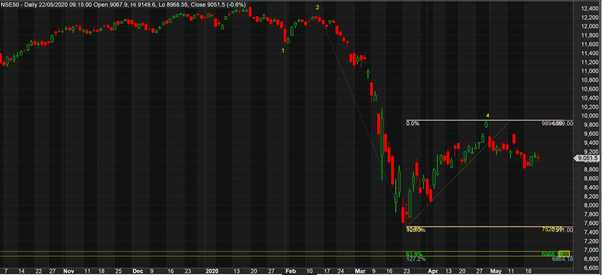
You would also observe 2 island reversals one after another (markets in magenta color). These are strong reversal signals that uptrend is over and markets want to go down. Top of second gap can also be used as SL levels for shorts (9370 around). This should give a profit target of 1150 against a risk of 320 points. (risk to Reward of 1:3.6).
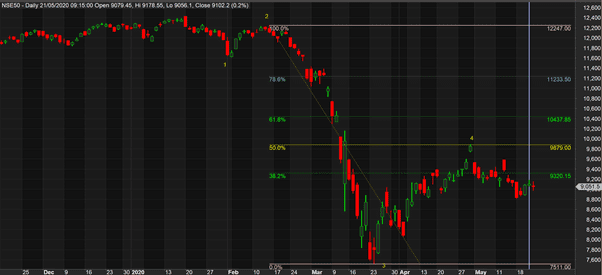
Little bit on Fibonacci
Previous up move has done exactly 50% of fall before it. This adds confidence to go short at these levels.
Little bit on Elliott waves
As per Elliot waves if we consider this fall to be a 1-2-3-4-5 impulse sequence, wave 5 targets should be between 6970 and 6860.
Options data
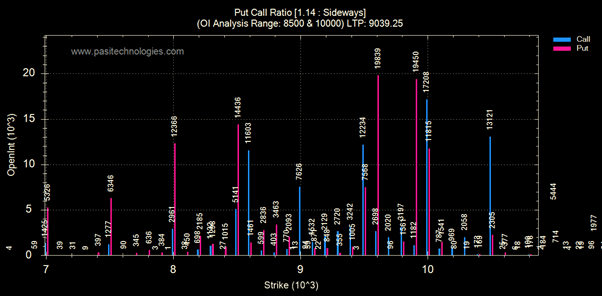
Past few months we have observed that options data is not been followed by markets. Looks like a lot of option sellers are loosing money in this fall (which usually happens as most of the options sellers go for sideways strategies to eat on time value or volatility. However for completeness sake we provide the details here.
June OI picture looks very distorted with lots of Put OI at 9600, 9900 and 10,000. Although its not exceptionally high number to be worried and only when May series rollover happens we will have a better picture.
