Markets in major correction? Time to sell? Or Time to invest?
Last few weeks we are getting lot of requests to talk about Nifty levels. We see trapped investors, many of them from mid and small caps. And also lot of investors who could not catch the post election rally and felt missed out then. Its very easy to say you must buy low and sell high. But the real question is how to identify those levels and how to get conviction to be able to invest in market…
Today we try to demystify…
Market structures – Theory
Markets are like fractals. Imagine a river. If you look at it from a very high altitude, you will be able to see a wide picture of its twists and turns. Between the twists and turns it will look smoth enough. But when you start going to lower levels, you will see those smooth areas to be made up of more twists and turns which are smooth at a different accuracy level. And if you go further close, you will get to see more and more details. There is no limit to the folds and frills that you will observe. You can use ultrasensitive microscope and still you will see a similar picture of the edges of the river.
This is exactly what you will see in the markets. And that is where most of the technical analysts get caught. What you see as a trend in daily could be a minor correction of a single bar on monthly charts. But on other hand if it is a reversal signal or continuation signal on monthly or even weekly charts, you have got a perfect position to trade long term. This is exactly we try to do by analysing various timeframes.
Today we will evaluate Nifty for broader picture and then try looking at some stock specific ideas.
Nifty – Weekly
Today we don’t provide Monthly analysis on Nifty as we don’t find anything new since last analysis here
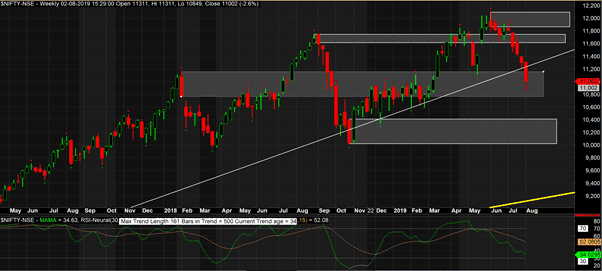
On weekly charts, we see that the weekly candle is closed below the weekly trend line (for details read last blog). However as per our breaking of trendline, we must see a whole candle below the trend line and so far we only consider it to be testing the line. Another point to note is that the candle is within an old resistance area (old support resistance are given lesser weightage if they have not been respected.
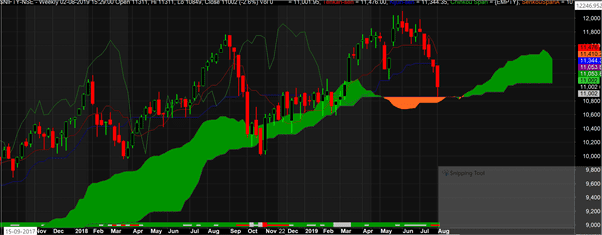
Observe how nicely the weekly candle is taking support from clouds.
Nifty Daily
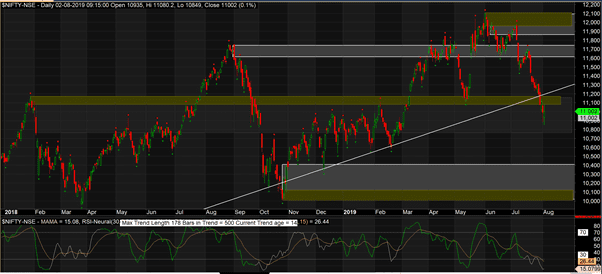
On daily charts the picture is looking very bad with a high probability target of 10,130 where next support is located. Remember, weekly support is more powerful than daily support, hence we should be cautious on triggering new short positions. However if we have earlier short positions in profit, there is no reason for booking profits if you are trding on daily timeframes.
US markets
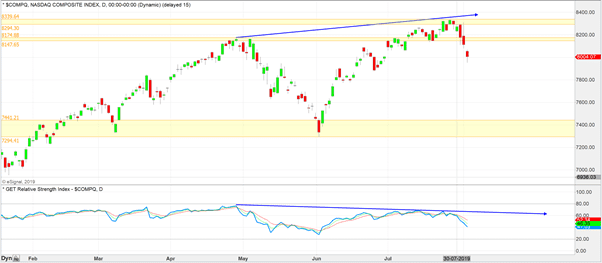
This week there is something very interesting happening in US markets, worthwhile mentioning. With reduction in interest rates, markets started a downmove.
We see a break of old resistance area on daily charts. Indian markets were correcting while global markets were hitting new high. Now if the global markets are going to correct, what should be reaction of Indian markets?
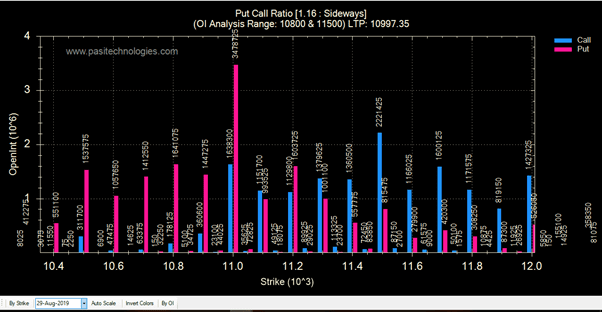
Nifty Options data
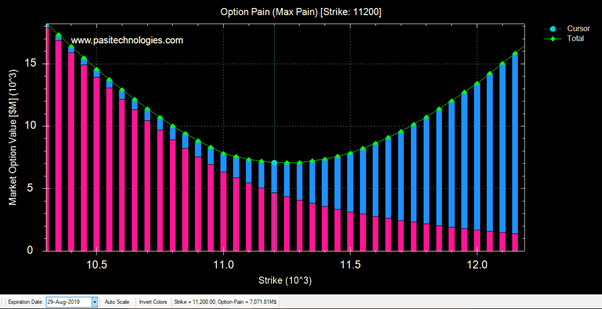
Max pain for August expiry is 200 points north at 11,200
Put Call ratio shows a range of 11000 to 11,500. With 11000 PE to have exceptionally high OI.
Top Contributors in Nifty
Top 10 constituents contribute about 62% to Nifty. So if you want to predict next move for nifty, you may like to see what they are planning to go through.
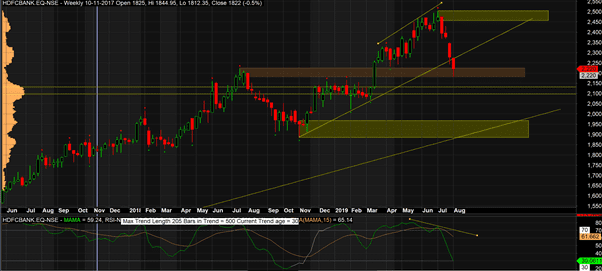
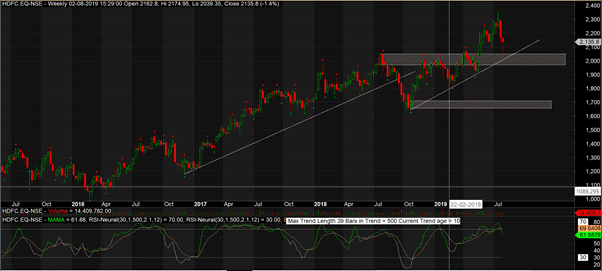
HDFC Bank Ltd. 10.73%
HDFCBank has started correction on weekly after a very prominent divergence. Currently its at old weak resistance levels and while it may hold this, a more probable level is band between 2100 and 2130. I will call is sideways to down.
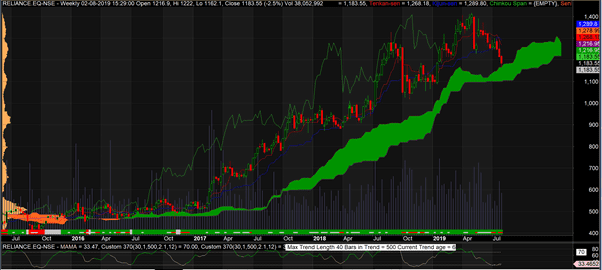
Reliance Industries Ltd. 8.81%
On weekly reliance looks to be right at cloud support.
Housing Development Finance Corporation 8.05%
HDFC shows to be right at previous resistance levels and also close to the trend line. High chances that it may reverse from here. But if broken, expect a 10%+ cut.
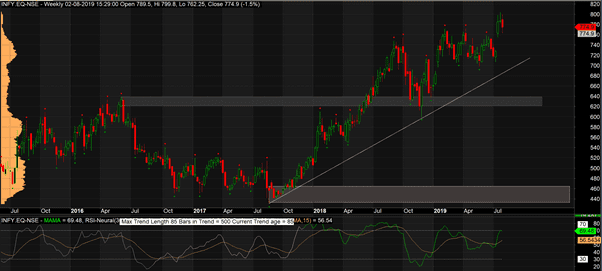
Infosys Ltd. 6.65%
Again Infy seems to be in upward move (may have minor correction)
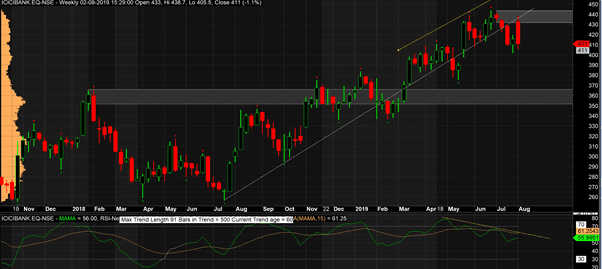
ICICI Bank Ltd. 6.04%
ICICI Bank has broken the trend and also have double divergence and is expected to find support only around 365 which is more than 10% fall
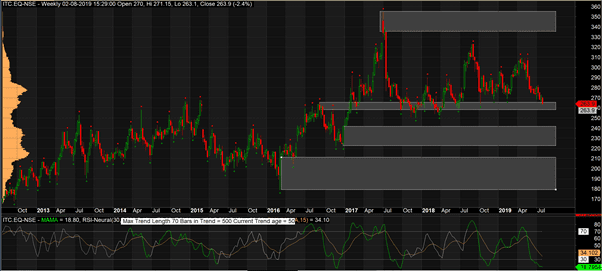
ITC Ltd. 5.12
ITC is testing the support level now for 6th time. Will it break this time? It will be interesting to watch. I will bet that it will break and test support at 242 levels – nearly 10% down.
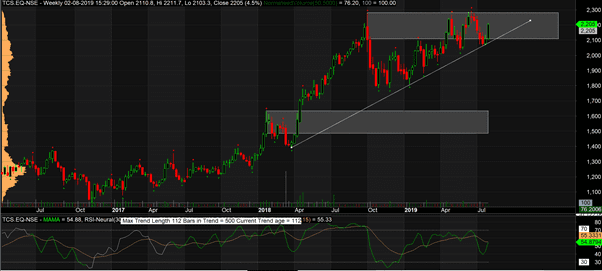
Tata Consultancy Services Ltd. 5.11%
TCS is right inside of weekly resistance level. If its able to break this at 2286, then a very good rally could be seen. Failing which expect a break of trend line and a fall to 1650 (more than 20% fall)
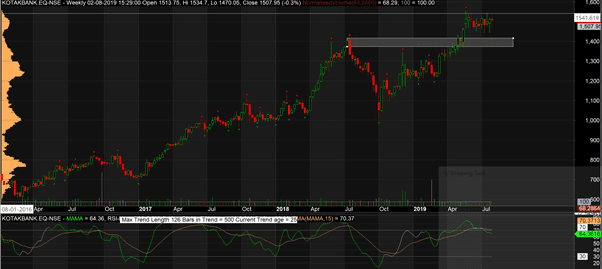
Kotak Mahindra Bank Ltd. 4.48
This chart looks to be strongest among the lot a long as it respects the support level of 1420. Yes, RSI shows overbought which has capability to play spoilsport. But not until 1370 is broken.
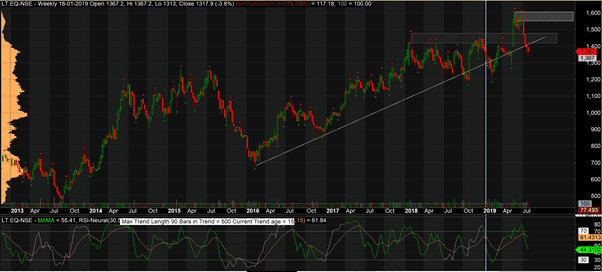
Larsen & Toubro Ltd. 3.78 %
After 3 times false break of trendline, will it finally break the trend line this time?For it to be a false break, I will wait till it crosses 1480 convincingly. Else a fall in LT has already started.
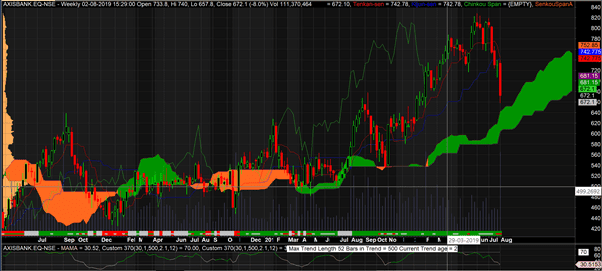
Axis Bank Ltd. 3.04%
We believe Axisbank should hold this cloud and start upmove.
Final Take
A major pullback on weekly timeframe does not look highly probable in Nifty. Most of the top 10 constituents are looking to be fairly placed. If you are holding good stocks, don’t panic. No more than 5-10% correction in Nifty expected at this point. With likelihood of the weekly trend line to be held for a next upmove.
If one has to invest new money, it can be done towards end of next week if that weekly bar closes way above the weekly trend line showing a good reversal with SL below last week low. However if you see whole weekly bar below this trend line, you may hedge your positions with a low prices put for December 2019 or March 2020 as the correction does not look to be very deep at this point in time. This will save you from missing opportunity if there is a reversal rally in market.
Very interesting post. Thanks for the detailed analysis.
Thanks a lot