In our last post, we discussed chances of Nifty holding the weekly long trend line. Today after 2 weeks we evaluate. Today also we skip Quarterly and Monthly analysis as nothing much has changed
Nifty Weekly
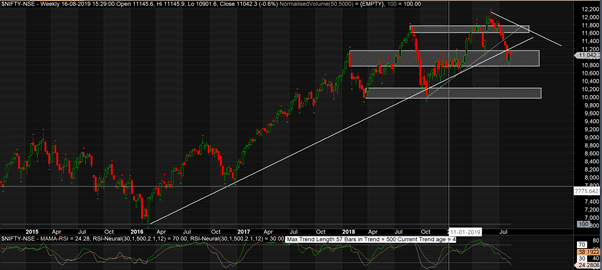
We clearly see that last 2 weeks of bars are below the trend line, hence the trend line is clearly broken. However the current support area is not yet broken which stands at 10750-11170 range.
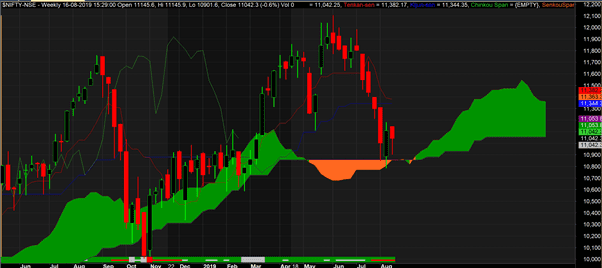
However we see the cloud supports on weekly to be held very well.
Nifty Daily
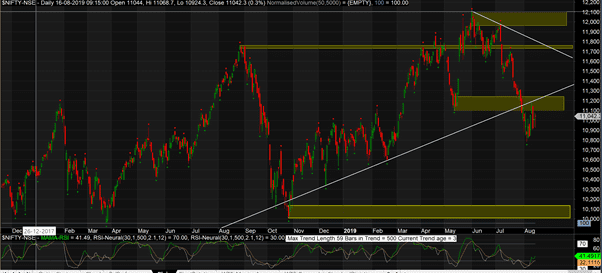
On Daily charts, Nifty has broken the support area and headed to 10,100. However the oscillator is coming up from oversold levels. We expect markets t go sideways for some time before going down to test 10,100 levels.
A very good risk reward is in favour for bears. If we go short at these levels around 11,000 a profit potential of about 850 points with a risk of about 250 points. But if we see past chart trends, be aware that markets tend to spend a lot of time between these levels and 10,100 levels ma not come in a hurry.
Options analysis
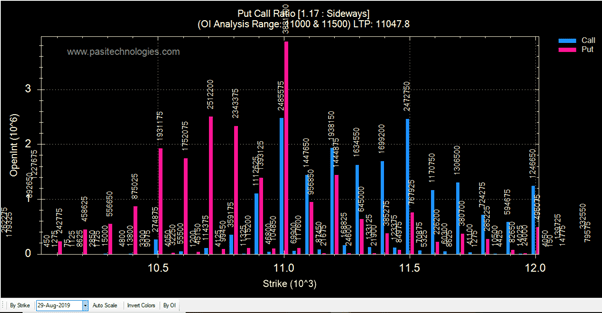
Put call ratio of 1.17 for August expiry shows even force by both bulls and bears. Markets should go sideways and looning at such a high OI at 11,000 Put and call, high probability that we will expire at these levels. However due to some unknown factor if market moves (which should be down following geo-political issues if any), then expect a major sudden move as lot of large option sellers will be caught wrong footed.