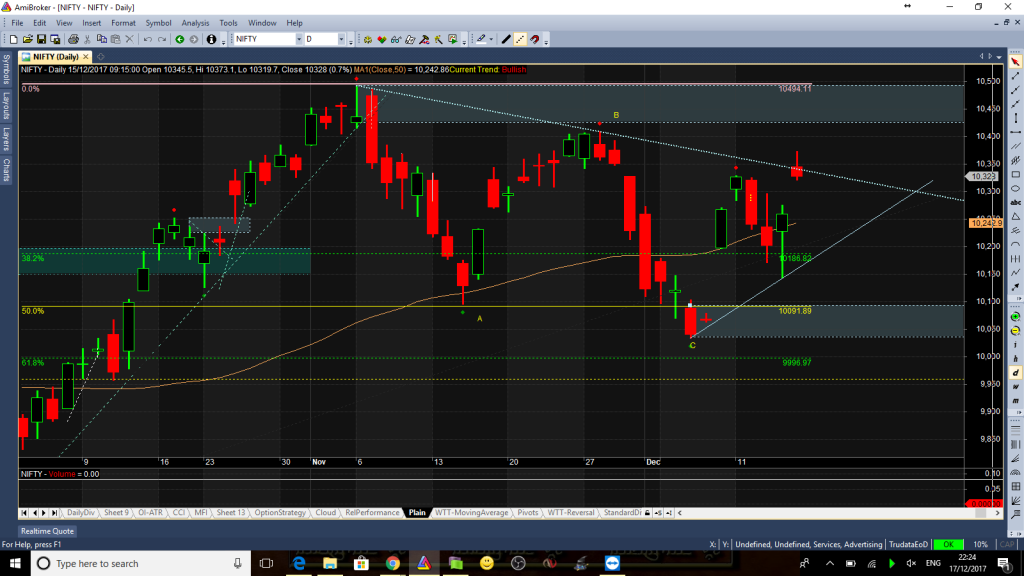
All those who would have followed last week analysis, would have got chances to trade this sideways market both down and up. 10,330 to 10,180 and then 10,180 to 10,350 – Total of 300 points. Markets behaved exactly as expected.
Next week starts with a election results and a lot of participants are expecting large move. As a chartist, I believe the trend is very much sideways.

This correction is nearly 61% of the last rally from 9700 till about 10,500. A range of 10,030 to 10,490 seems to be very much in place.
One very interesting point about this correction is that it has seen a lots of gaps. Gaps are created by emotions and emotional people. In rare condition, for a security or commodity the market all of a sudden realises that they have missed on some vital fact and then overnight the calculations are done reflecting a gapup or gapdown. These gaps mostly are honored for fairly long time and are called run away gaps. Its very safe to use these gaps as stop loss levels.
Second type of gaps happen when volatility is rising and markets are getting too much emotional. Large and systems players use these gaps and emotions to their benefit by placing opposite trades. To understand, lets say you are a huge player and want to buy Nifty at around 10,100 levels. and you have been waiting for it since end of Oct 2017. On 6th and 7th December Nifty came down to 10,100, But on that day some of your technical indicators gave you sell signal, news flow was fairly negative, so you choose to only deploy 10% of your capital. To your surprise on 8th Nifty has given a gap up. and now although you want to buy, but you know that if now you deploy thousands of crores, markets will just keep going up and you may not get effective price. What would you do? If I was the person, I would sell those 10% money that I have invested with some negative news to create panic in market and to get prices down, when normal public will start selling, I will slowly and steadily invest all of my 100%.
Most of the times, second type of gaps are filled in a short time period.
In whole history of nifty I guess there is only one gap around 2000 levels which is a genuine run away gap. Its rather exceptional to have gaps in Indices as most of the times a lot of people are doing lot of analysis about indices and such huge surprises for those seasoned players are vary very rare.
Options OI clearly shows range of 10,000 to 10,500.

I am really enjoying the theme/design of your
site. Do you ever run into any web browser compatibility issues?
A few of my blog readers have complained about my website not working correctly
in Explorer but looks great in Chrome. Do you have any solutions
to help fix this problem?