Nifty looks to be in clear uptrend on smaller timeframe charts (75 mins) while on daily charts it seems to be in sideways mode.
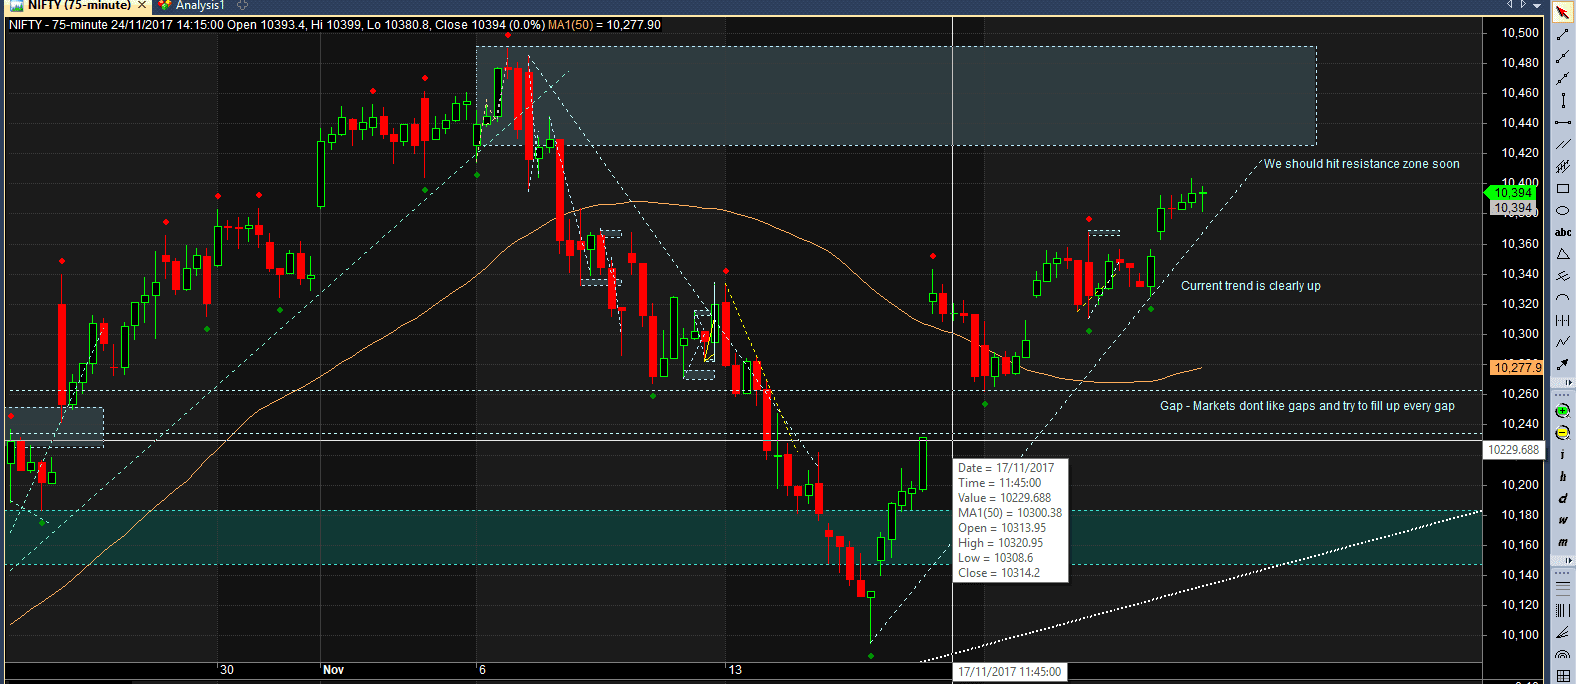
We should approach the resistance zone @ around 10420 – 10500 very soon most likely next week itself. Expect pressure when it hits this zone. Coupled with expiry, this level will be an interesting level to initiate short positions (traders only – at your own risk)
In last week of expiry, Options data shows very nice picture. The options OI works very well.
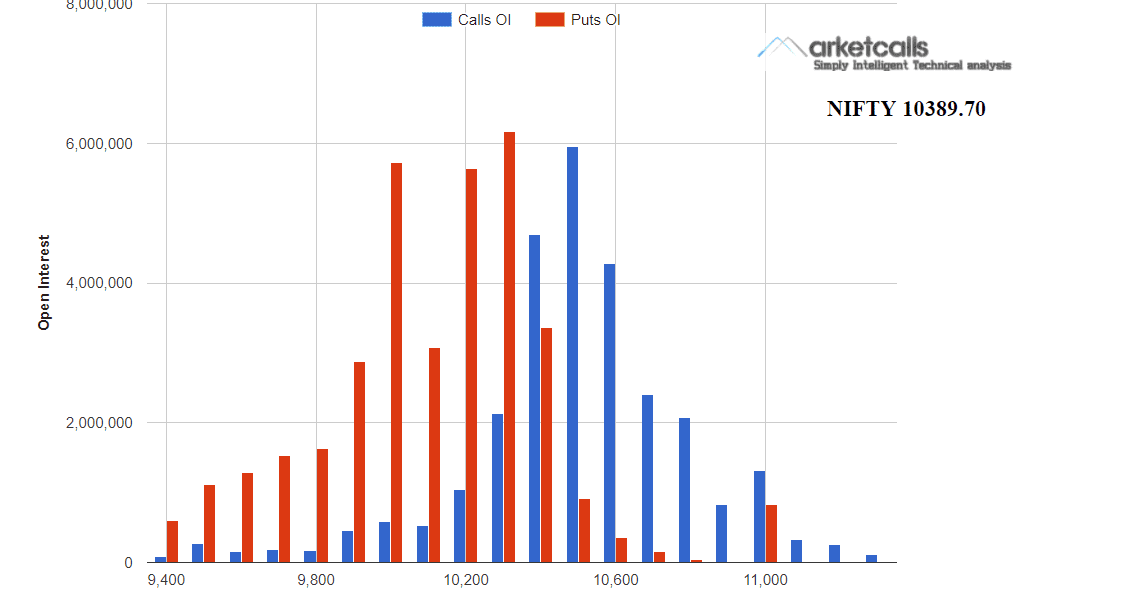
OI recommends a range of 10300 to 10500 for this expiry. The more interesting picture is how Put side OI is increasing and Call side OI is reducing – This is happening for last 2-3 days. Below is the picture of Friday 24th
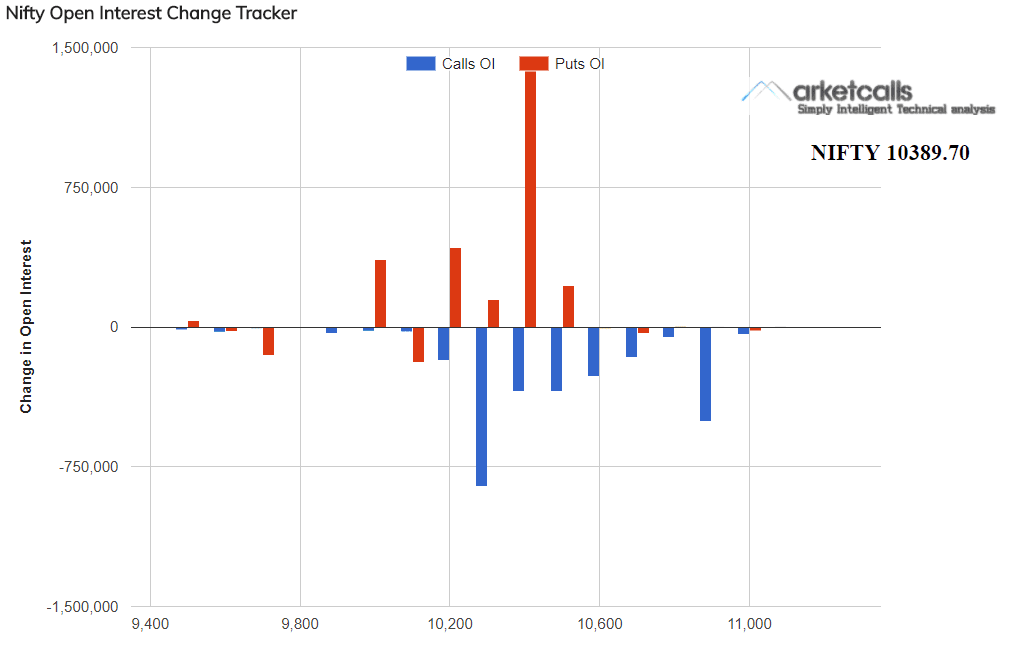
This makes me believe that markets want to move up.
But there also is a case for bears –
Remember, on daily charts we are in sideways move with decent resistence between 10,425 and 10,500. 10,500 being max CE OI would also act as a resistance.
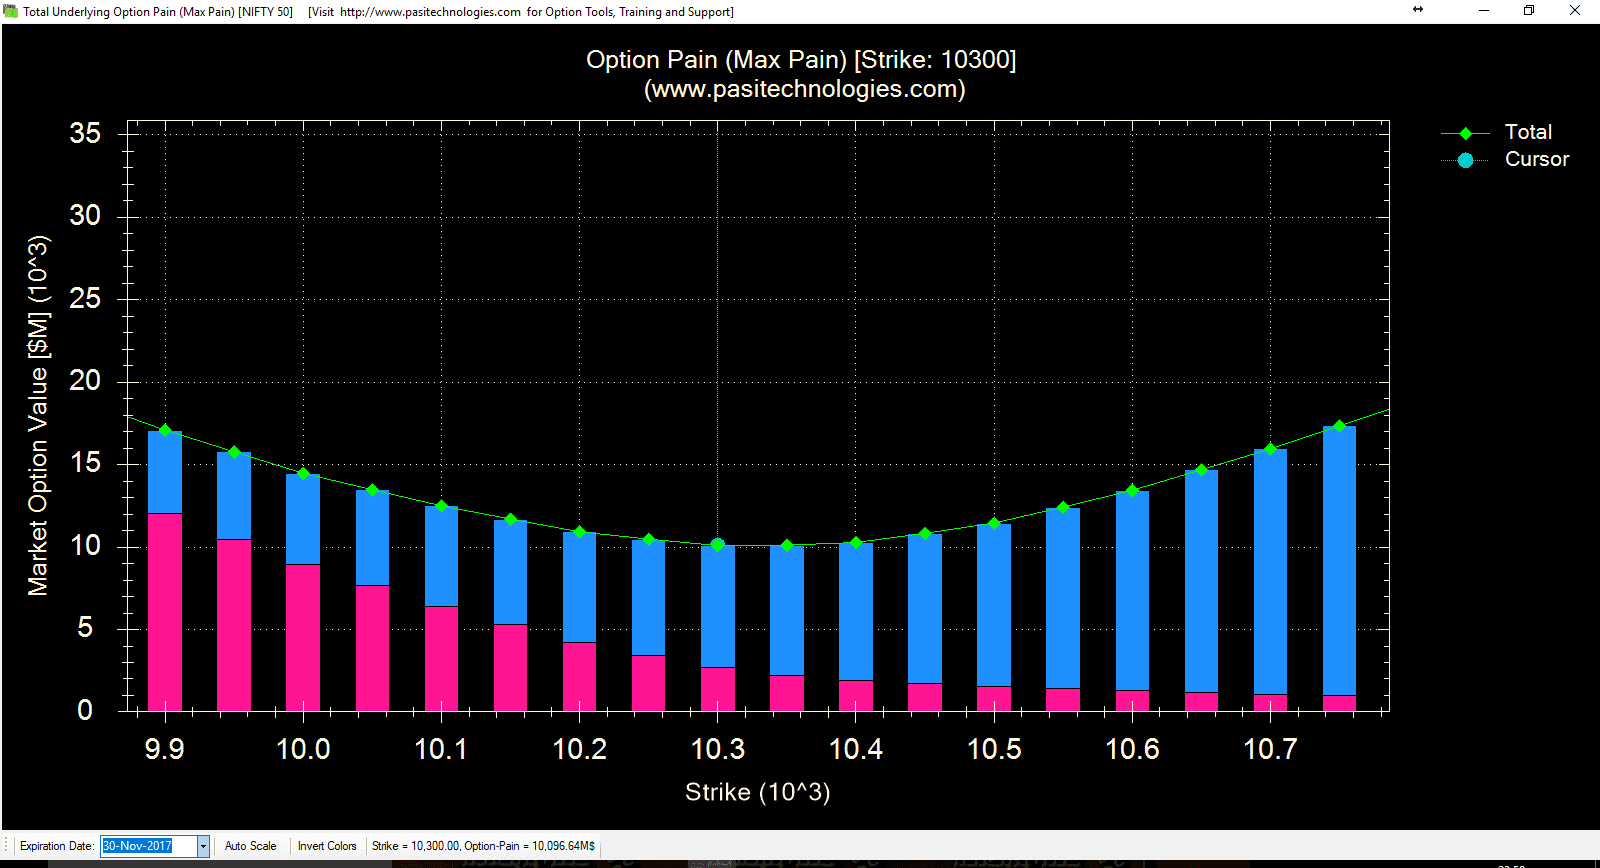
If you look at Max pain – It actually is seen at 10.300 and not higher!!!
And there is a gap between 10,260 and 10,230. Based on my observation and experience, markets dont like gaps and it comes to fill every gap.
Interestingly Max pain of Dec 2017 is even lower at 10,000…
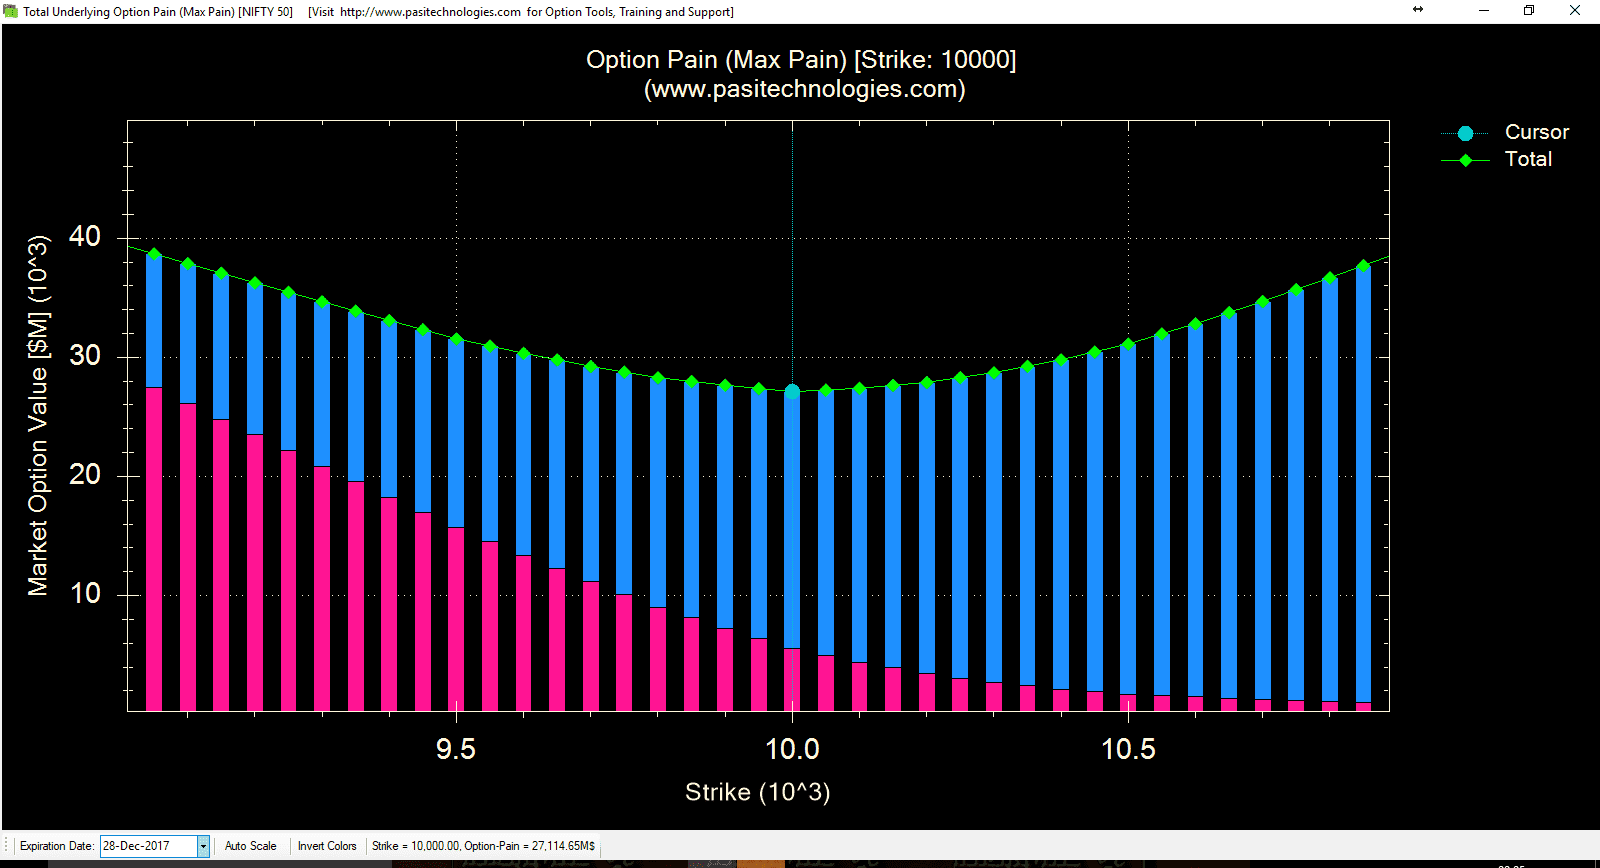
and even max CE writing is done at strike 10,000 for December series…. (Looks like these strong hands have some special plans for Christmas!!!)
Next week should be a fun week. However if we are able to close above 10,500 then we yet again will be in uncharted territory and a move of 200-300 point + can be expected. Else November expiry around 10,3000 and december expiry around 10,000 level is what options data suggests…
Lets see… and learn ….