Last week was a week after which many analysts and investors must have been gone back to their charts. I am no different.
But myself and many of my followers are rather enjoying this fall rather than getting worried. We have been preparing for a market top since some time. Here I present my current analysis.
At a high level, we definitely are in downward trend on daily and weekly charts, Long term charts suggest a deeper cut. However in short term Nifty may test levels of 11,640 and if it crosses 11,700, then bears need to evaluate their positions. However, Options data is recommending very good pullback and hence trading needs to be done with SL with position sizing which allows you to take such risks.
Below is detailed analysis
Nifty Quarterly
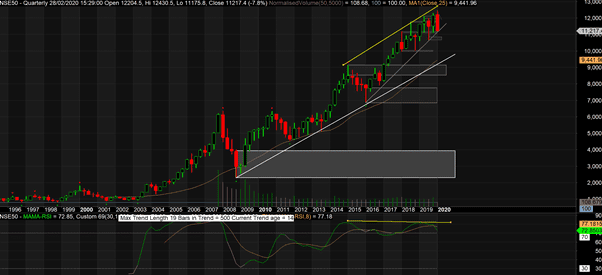
There is a potential bearish divergence in Quarterly charts. Potential because the quarter is not yet over. If the overbought RSI comes down on quarterly charts, you may expect a decent crack of about 2-3 quarters down move. Last time RSI just dipped a little bit from overbought in 2015-2016 with a fall from 9100 to 6860 (24.6% correction). We will know it better by end of the quarter.
Nifty Monthly
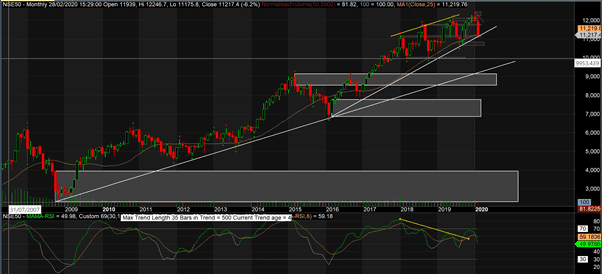
We very much are still in a upword trend in Monthly charts. Only important point to note is that last few months we were tracking a double diversion in RSI which got broken out in last leg of the trend and again RSI is started moving down. This is mildly bearish.
Nifty Weekly
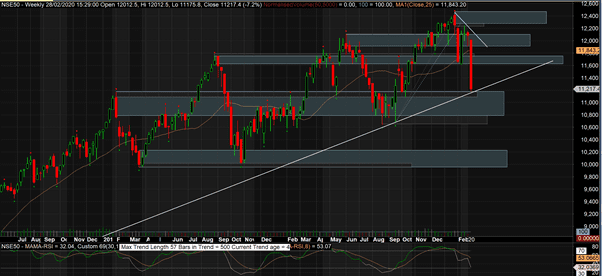
Weekly charts look more of slow upmove (rather sideways) with lot of supply-demand areas. More the supply demand areas – more hurdle for it to have an upmove. Last trend on weekly charts has confirmed downtrend after last week long candle. We are also just above a major demand area and a monthly trend line. Nifty has to put in some struggle to either show an upmove or a downmove.middle of this candle around 11600 may act a major resistance while 11170 will act as a decent support.
Nifty Daily
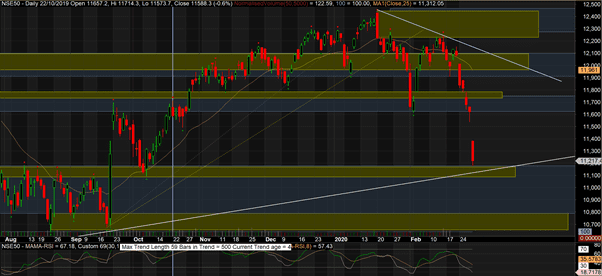
While looking at daily analysis we have retained weekly areas also as a reference. Please review the drawing in yellow for daily levels. As we looked at weekly, we are right near a demand area around 11170 and we may expect a minor reversal to 11,640 levels. For this downturn to be valid, 11,640 need not be broken. So if you are already short on market evaluate exiting shorts above 11,650 levels.
Another point to note is gaps that Nifty creates between 11,170 and 11,640. Please review the next chart for the same
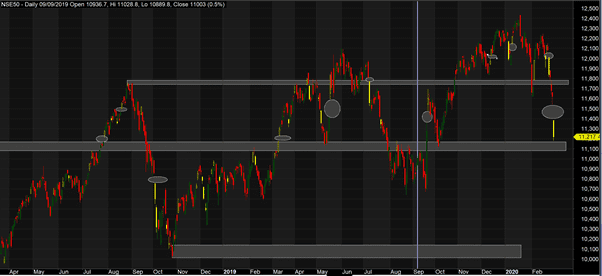
We have marked only important gaps. But it is observed that while most of the recent gaps are filled, but after gap day there is no immediate reversal (except for 23 Sep gap post FM anouncement)and that the trend continues at least for one more days. If I give importance to that, we may have left just enough strength to break this demand area and break below 11,000 and test 10,600 levels.
Nifty PE ratios
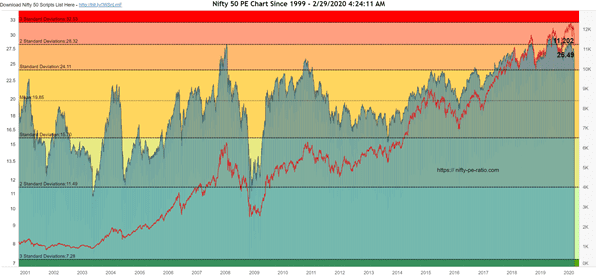
While we see PE ratios back in second deviation, we still have a very long way to the mean of about 15.7. if the situation worsens and we come down to a PE ratio of 15.7 (assuming no change in earnings) – Nifty should be trading at 6,900 levels. (I plan to do another analysis for advanced technical analysts and there I will explain why 6,900 may not be an impossible level to reach)
Options Data
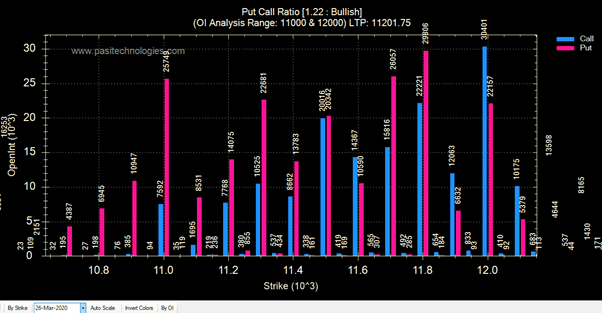
Put call ratio of 1.22 is bullish. Maximum PE writing is done at 11,800 levels and call writing is done at 12,000 levels. Options data definitely suggests a test of 11,800 levels. This space needs to be watched very closely by the bears
Note on Fundamental
In trading 101, we learn that whenever there is news based selling, we should ask question if this is one of news or the markets are going to hear this news repeated. We believe that this virus news is only going to open more negative news in time to come. In such scenario, we believe the downward trend is going to continue…