Technical analysis is watching in rear view mirror and estimating what may happen next. There are days like Friday 20th September which are impossible to predict (unless the news has leaked out earlier). But then no analyst can predict such surprises. Its only your discipline and risk management that saves you from such surprise.
In last publication on 02 Sep, we mentioned about possible weekly cloud support and looks like now that should be a primary consideration. So lets start with weekly analysis.
Nifty Weekly
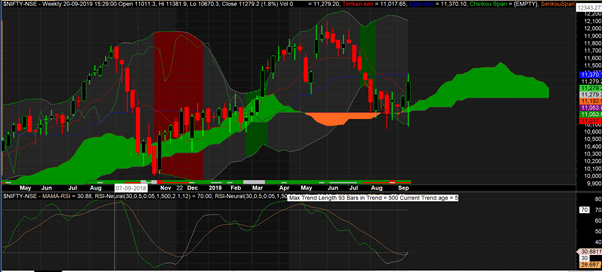
It is not just the Cloud but also many oscillators like RSI, stochastics have turned from oversold to back into buying mode.
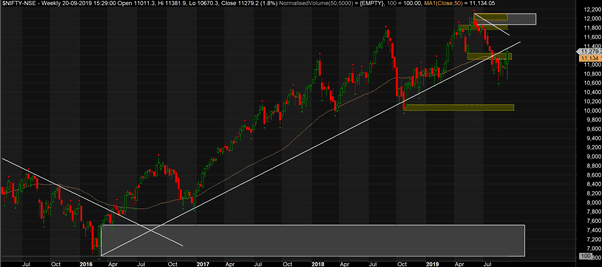
On the supply demand side, we still are below the trend line, but have successfully broken daily resistance levels.
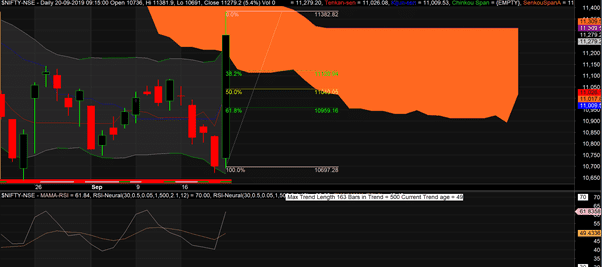
Nifty Daily
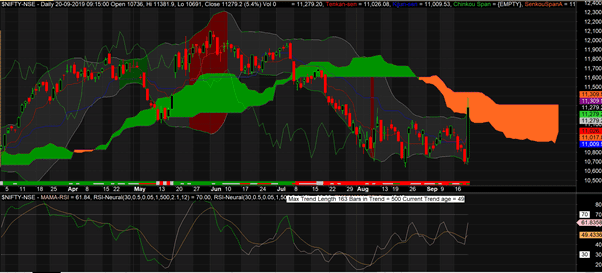
Nifty chart on daily timeframe shows exactly opposite picture.
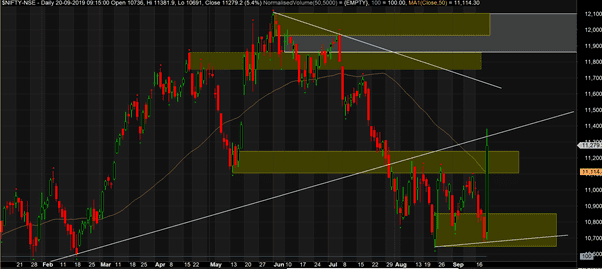
We are right below the cloud resistance and it needs to be broken before we assume trend change for trend followers.
We will need a full daily candle above 11250 to say that we have successfully broken the resistance area.
Option Greeks analysis
In volatile markets when its difficult to do technical analysis, option greeks often come handy. Option greeks let us know how large players are playing the markets. Even if you believe that the large players are caught with surprise, they will often figure out ways to get out of mess one way or another.
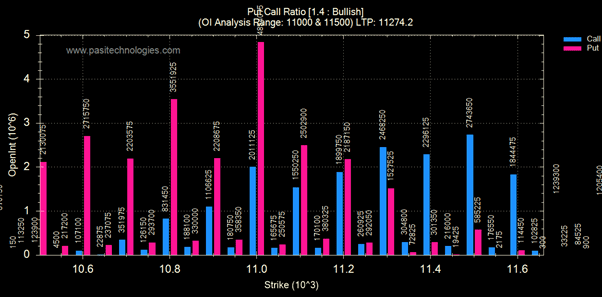
Put call ratio does not show much into the game at this point in time with a range of 11,000 to 11,500. If you look at net OI addition on Friday, On call side 11,300 CE added new OI while all the strikes below 11,300 CE on call side reduced OI. On Put side 11,400 PE and below added OI (11400 being a very small number and 11,300 being first significant).
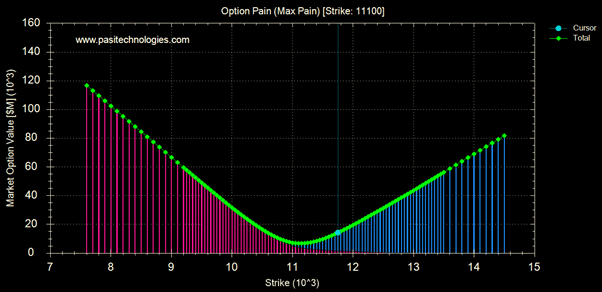
Option pain is at 11,100. Giving possibility of expiry at 11,100 levels
With all the above analysis, its very difficult to decide on the direction. However, it looks like markets will try to test bottom of Friday’s rally. As per Fibonacci, A level of 50% and then 62% of Friday candle then becomes important. So if you plan to go long you may choose SL of 11,040, or 10,960.
A better understanding will come in if we analyse top Nifty contributers.
HDFC Bank
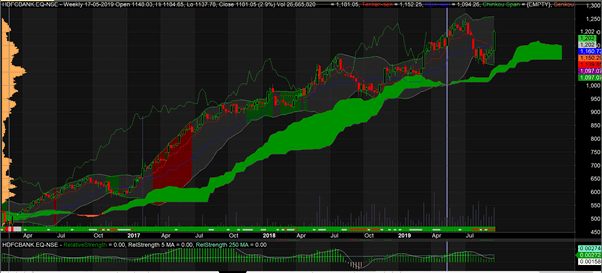
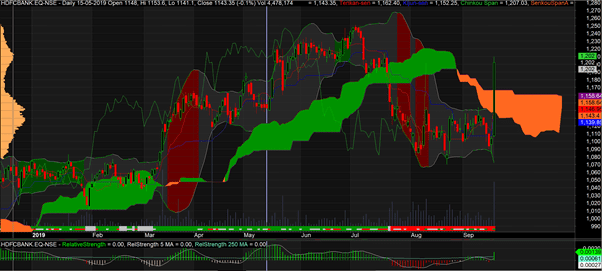
Both in weekly and daily chart, HDFC Bank looks to be bullish
Reliance
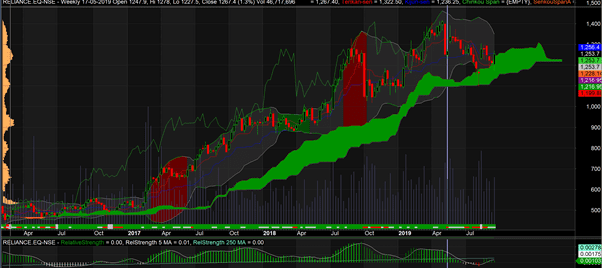
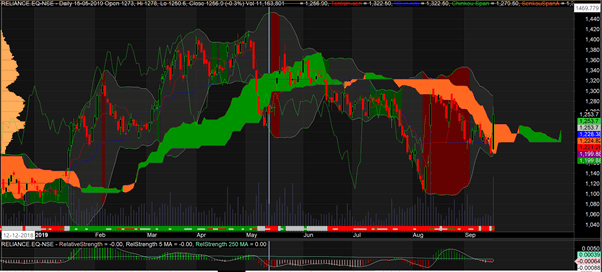
RIL has high chance of going sideways. SL of 1080.
HDFC
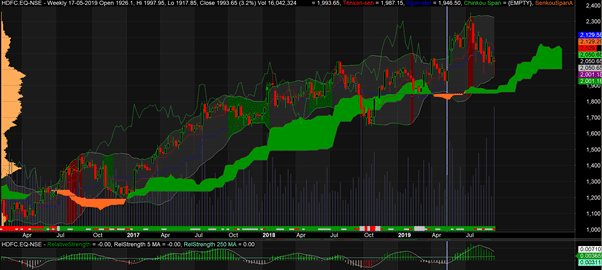
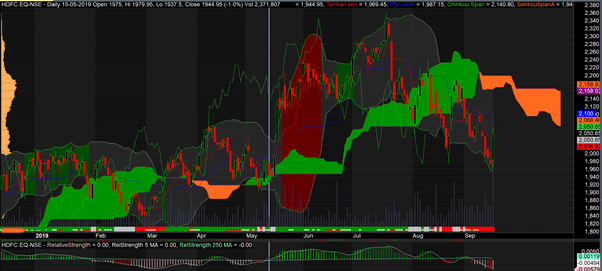
HDFC seems to be still in downward move. It may not have a huge downside, but will take time to go up
Infy
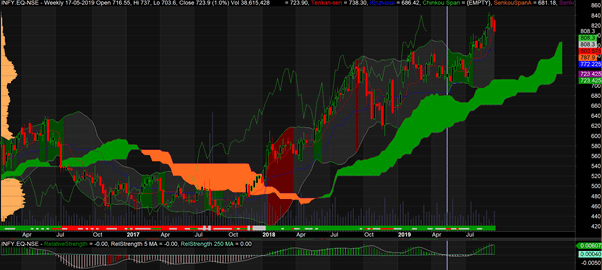
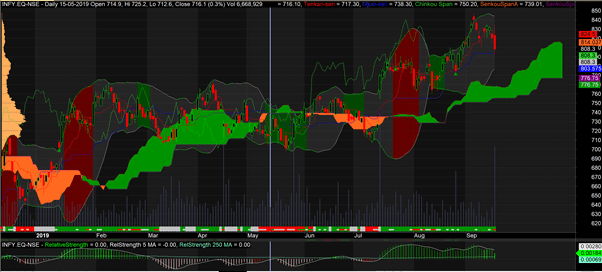
Infy also seems to be in a minor correction mode
ICICI Bank
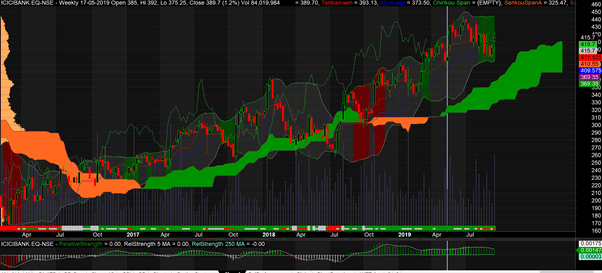
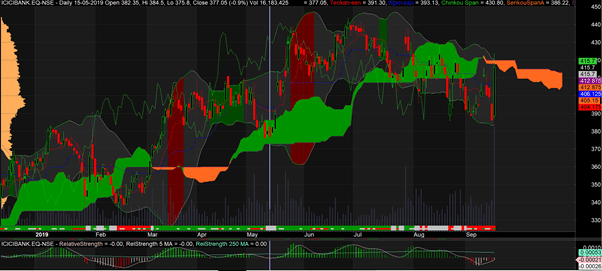
ICICI Bank should go sideways to down. Watch out for daily Cloud for breakout
ITC
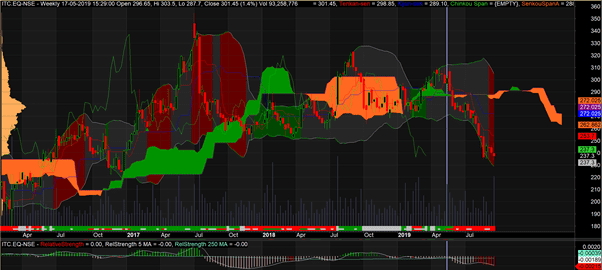

Investors should stay away from ITC, This may go sideways, but stock is very weak
TCS
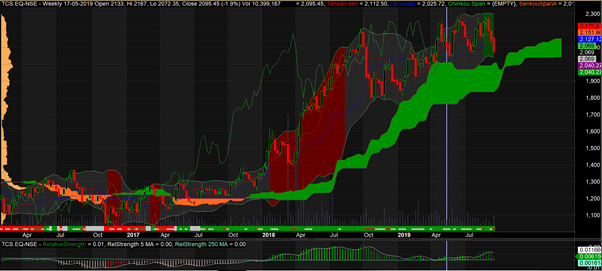
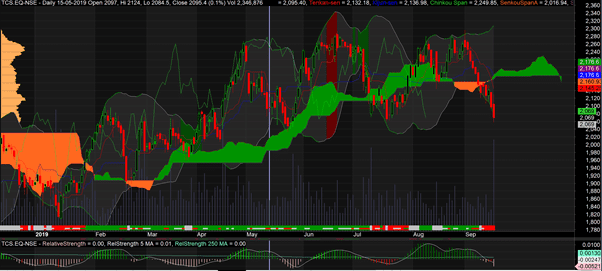
TCS is sideways on weekly and downward for daily charts
KotakBank
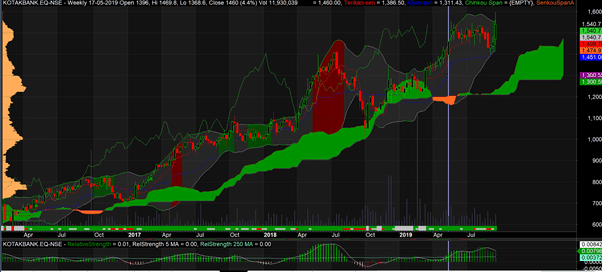
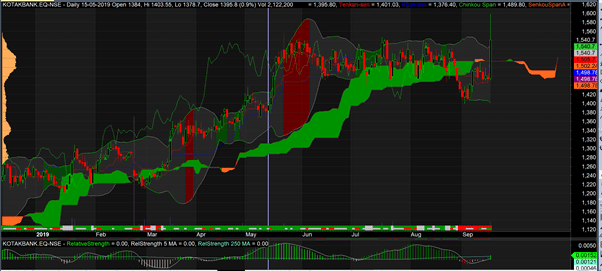
KotakBank is at all time high and looks very positive on daily charts, however not so strong on wekly charts
L&T
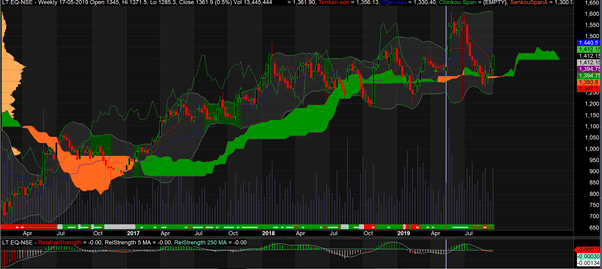
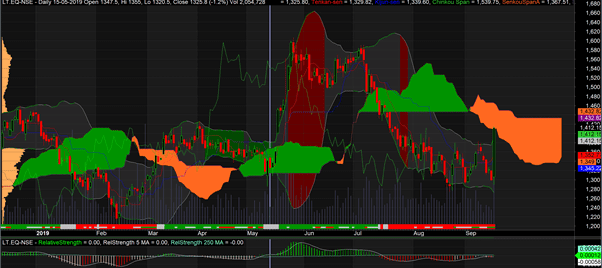
L&T looks to be strong on weekly but has a good hurdle on daily at around 1432.
AxisBank
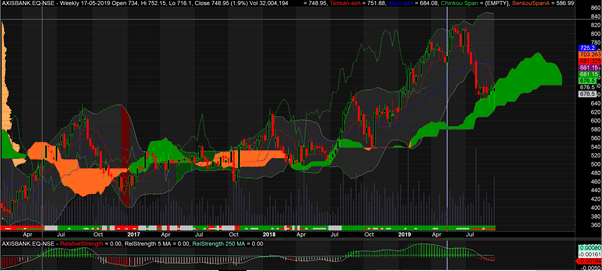

Axisbank is right at weekly support level and it may take the support, but daily loos weak. Expect a sideways move unless 720 is achieved (which is difficult looking at weekly charts)
| Company | Nifty % Weight | Weekly | Daily |
| HDFC Bank | 10.70% | UP | UP |
| Reliance | 9.51% | Sideways | Sideways |
| HDFC | 8.29% | Sideways | Down |
| Infy | 6.89% | Down | Down |
| ICICI | 5.88% | Sideways | Down |
| TCS | 5.28% | Sideways | Down |
| ITC | 4.69% | Down | Down |
| Kotak Bank | 4.26% | Sideways | UP |
| L&T | 3.65% | UP | Down |
| Axis | 3.02% | UP | Down |
Final Take
Nifty charts are not giving any confirmed direction, Options analysis is showing either small correction to 11,100 or a sideways move to 11,300. And top 10 nifty constituents (62%) are not showing aggressive UP move.
Looking at all this, we don’t see a run away rally from here on and we recommend investors to wait few days and go long stock specific only in stocks which are showing strong momentum. We also recommend strict SL and effective risk management.