From a recent low of 10,000 Nifty has shown a very good re-tracement rally to 10,900 levels. In our post on 07 Oct we had mentioned possible support at 10,000. I am sure, readers here were able to use this level to reduce short position and also to create a new long (As per your trading plan)
Now we are close to another resistance area, today’s analysis is to work out plan for next few months.
Monthly Analysis
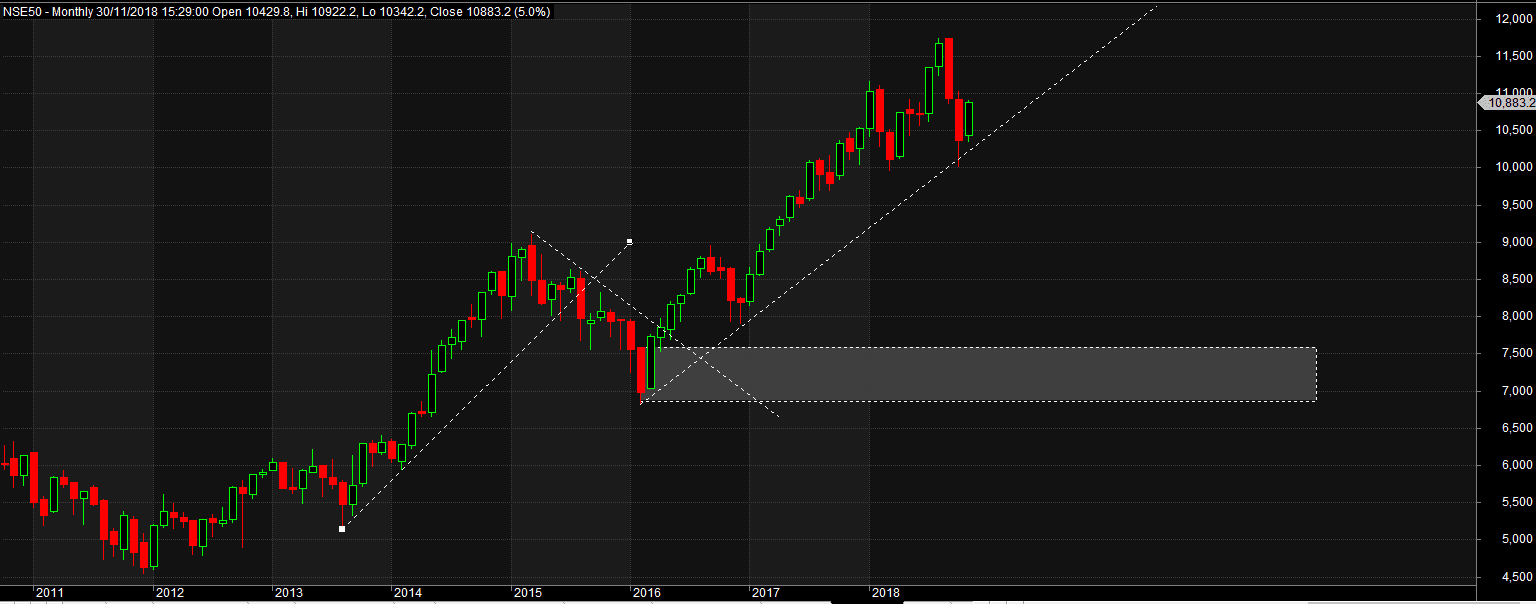
On Monthly, we have honored a trend line and have reveresed to show that we are very much in upward trend.
Weekly
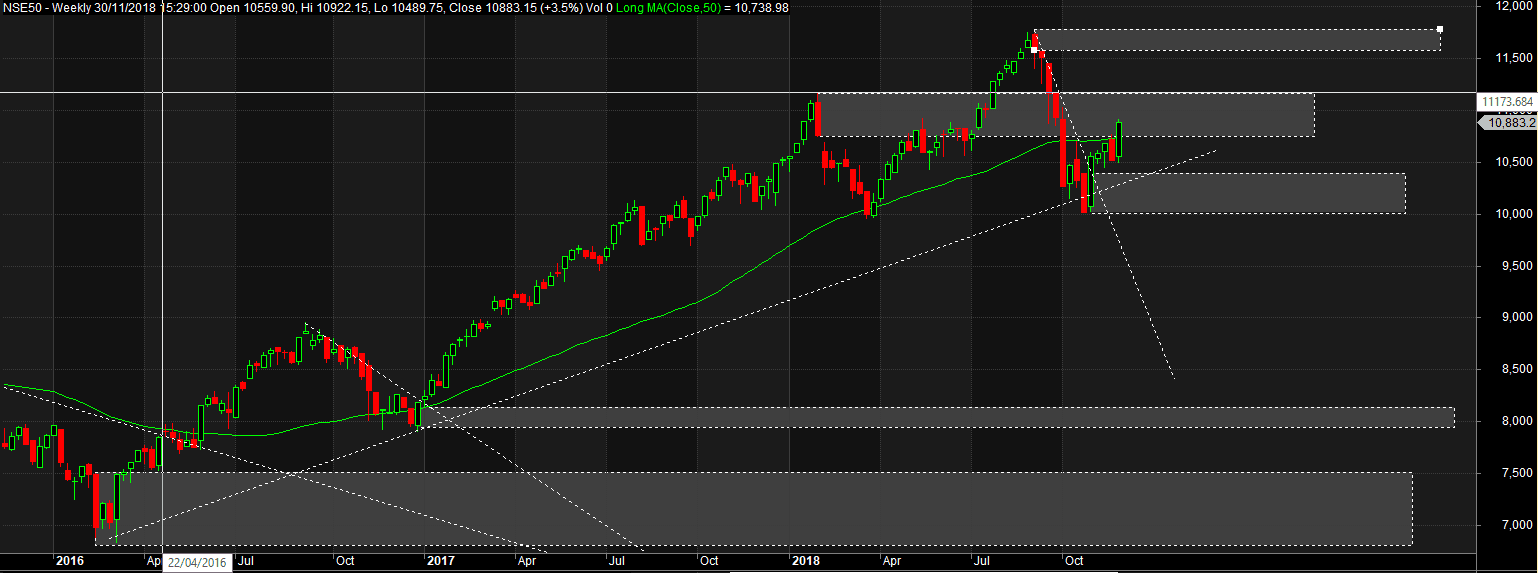
On weekly, we are seen more on sideways right on the resistance area between 11,080 and 11,170. Watching this area will answer direction of next decent move on daily.
Daily
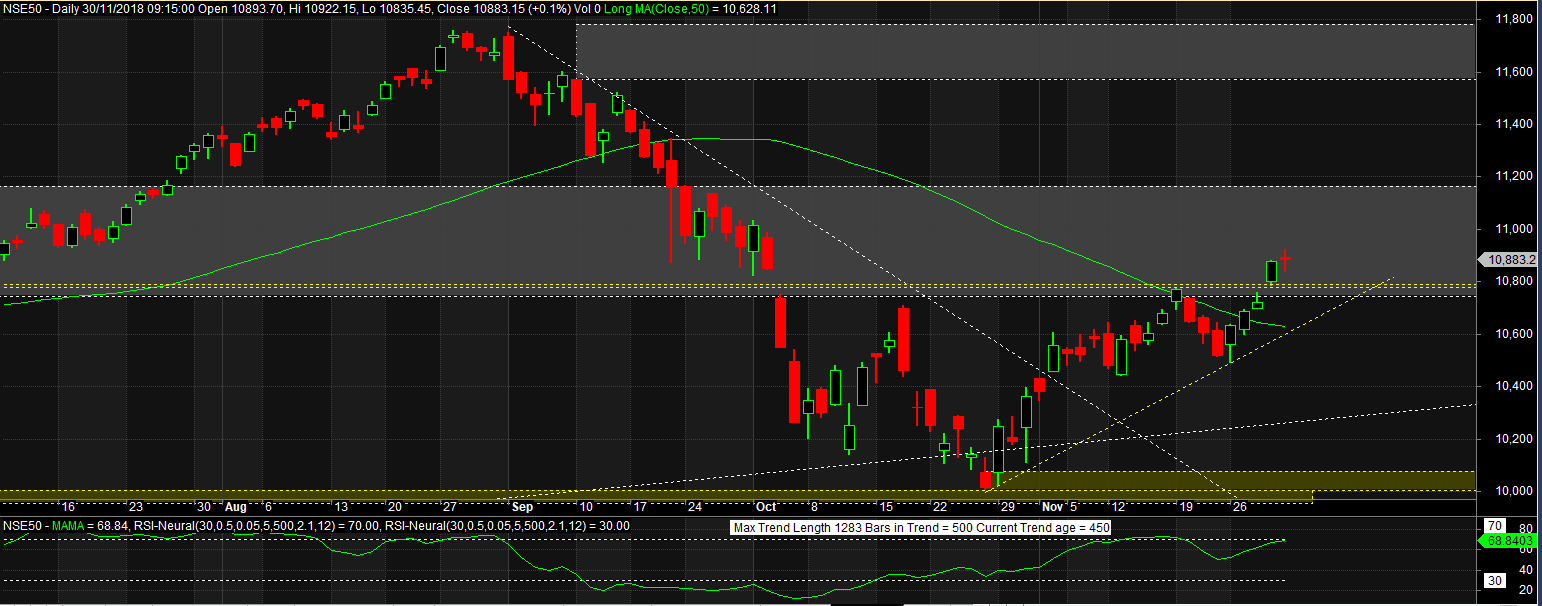
On Daily chart, again we are very much in uptrend and close of the resistance level above 11,170 will finally declare a start of wave 3. I call this wave 3 (Elliot Wave) simply because I see break of gap with a gap. However I put a caution and will wait for cross of 11,170 with full candle above these levels.
I also observe RSI to be close to 70 levels, if it crosses above 70, there will be second confirmation.
For third confirmation, I would look at ichimoku Cloud.
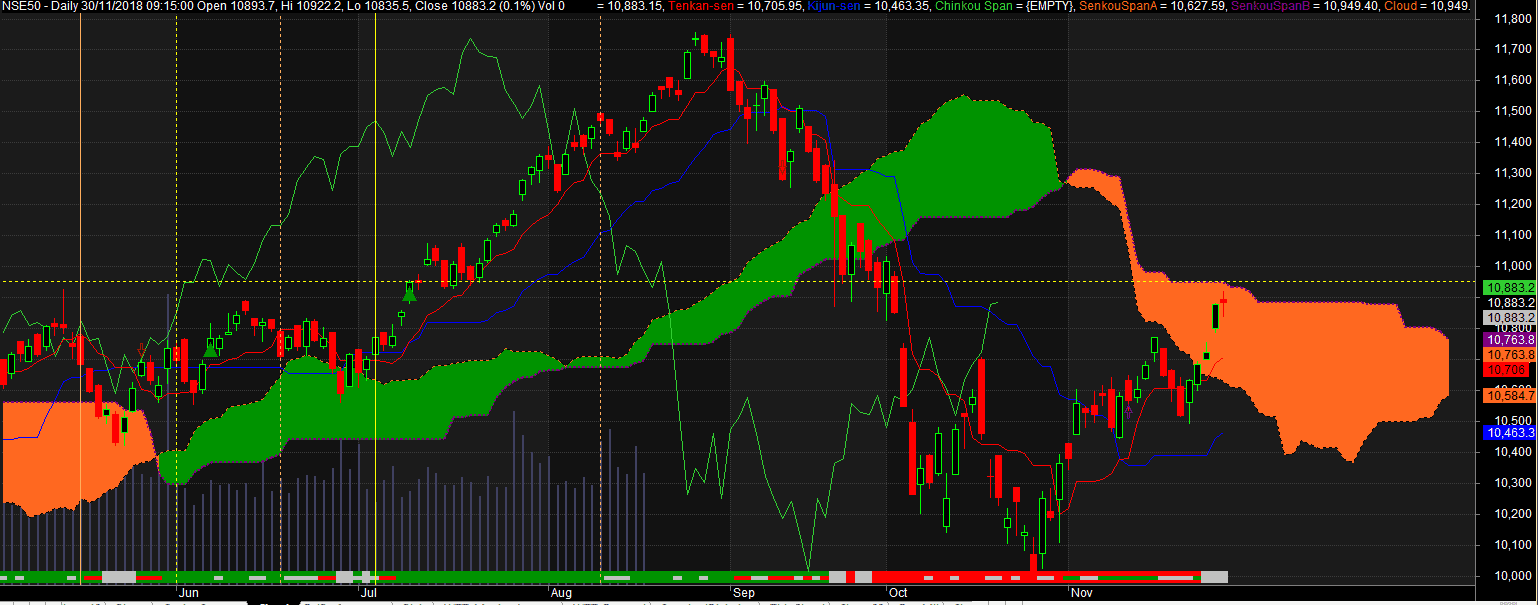
With fair bit of confidence it looks like by the time price reaches 11,170 we would have broken the cloud with chikao free also. This will fit our long term portfolio building strategy since weekly and monthly is already above cloud.
So, in short, if we break 11,170, we should be able to go long with confidence for first target around 11,600 and on break of 11,800 a very high long term open target.
However, we believe break of 11,170 is going to be very difficult for markets and that markets are going to honor this resistance level and will reverse.
PE Analysis
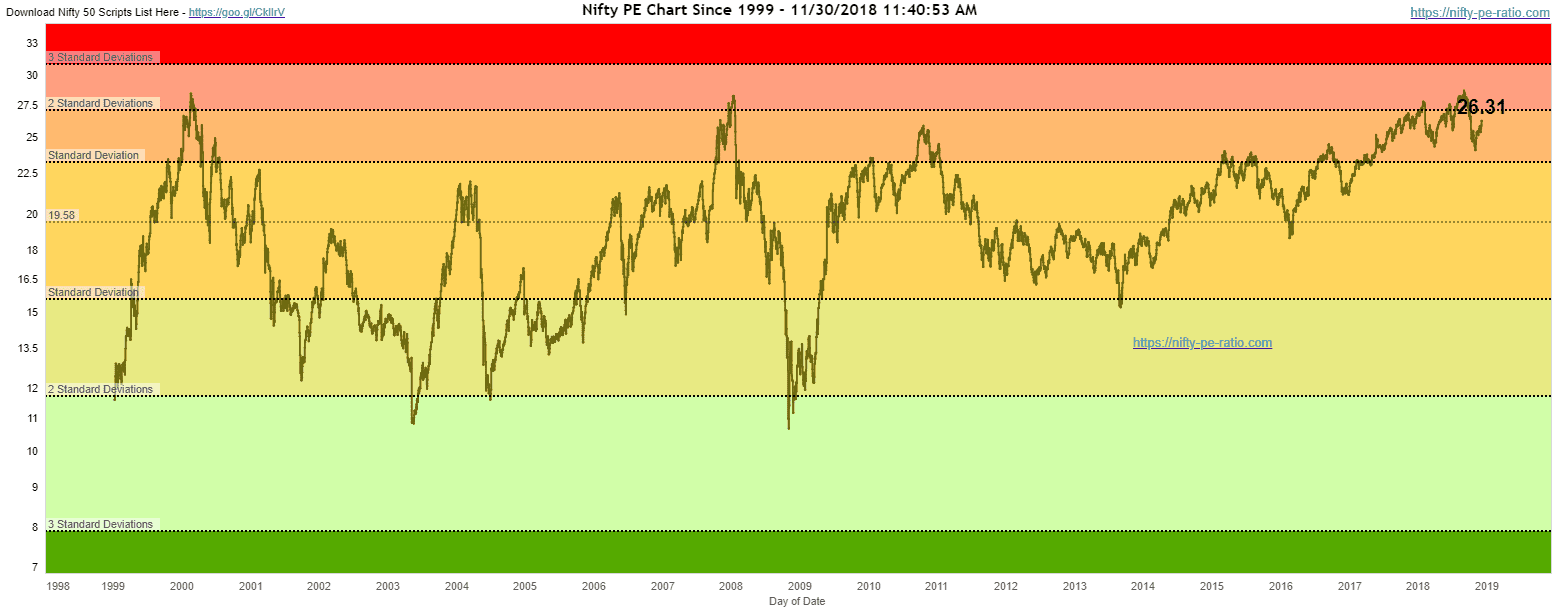
Nifty PE is still at fairly high levels for any large fund to invest fully.
Options analysis
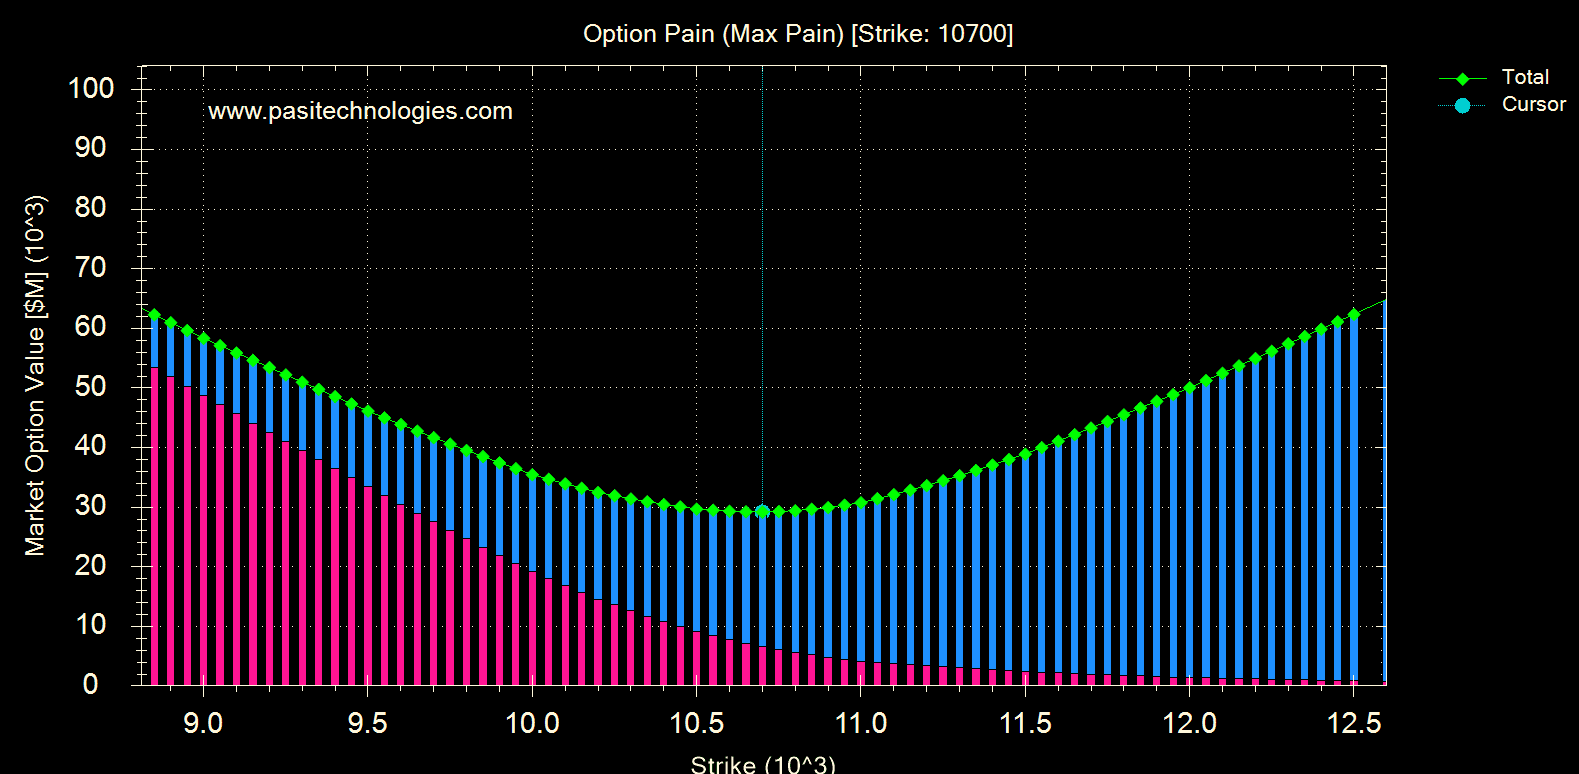
Nifty Option pain is still 10,700 which is below current strike.
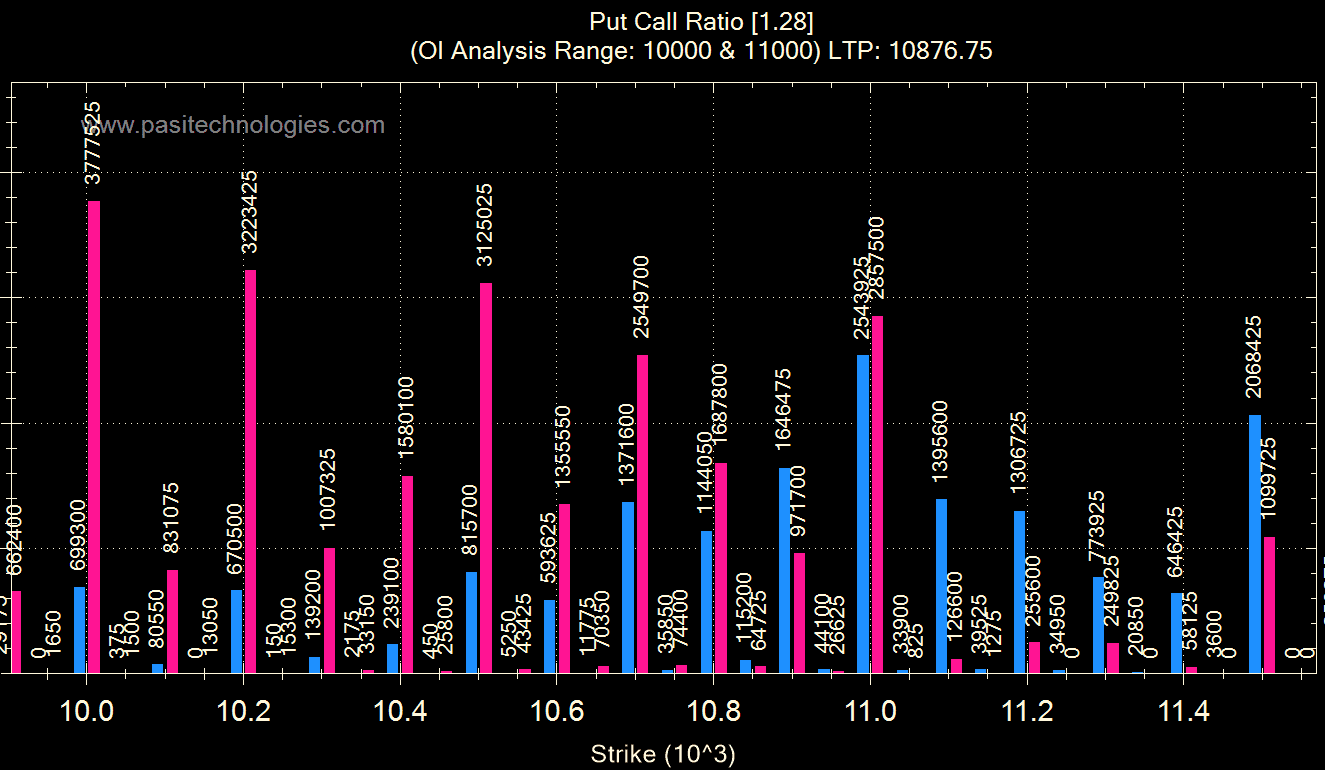
Another interesting point to note is that OI of 11,000 on put side is too high. Could they be option writers or option buyers? Option writers usually write out of money options and option buyers buy in the money options…
Lets look at further details. Below is option 11,000 PE 15 min chart. with that I also have Nfity spot and OI
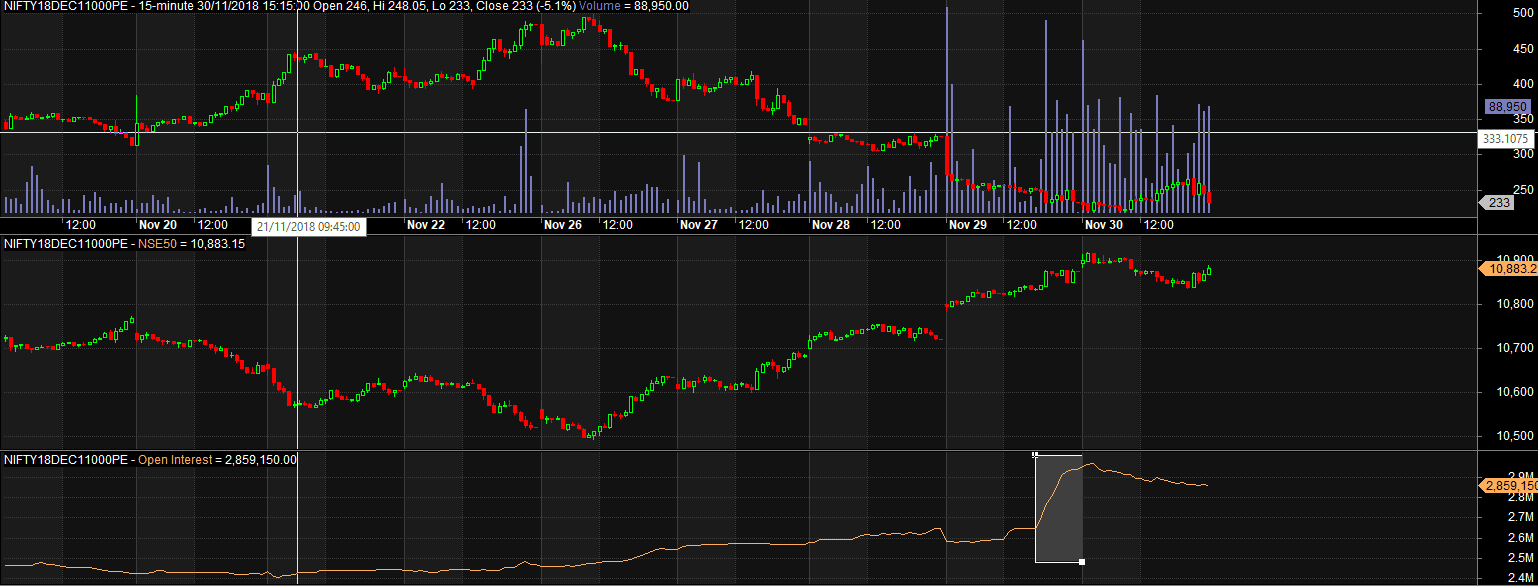
Most of the OI got added on expiry day last few minutes.
lets compare this chart to 11,000 CE
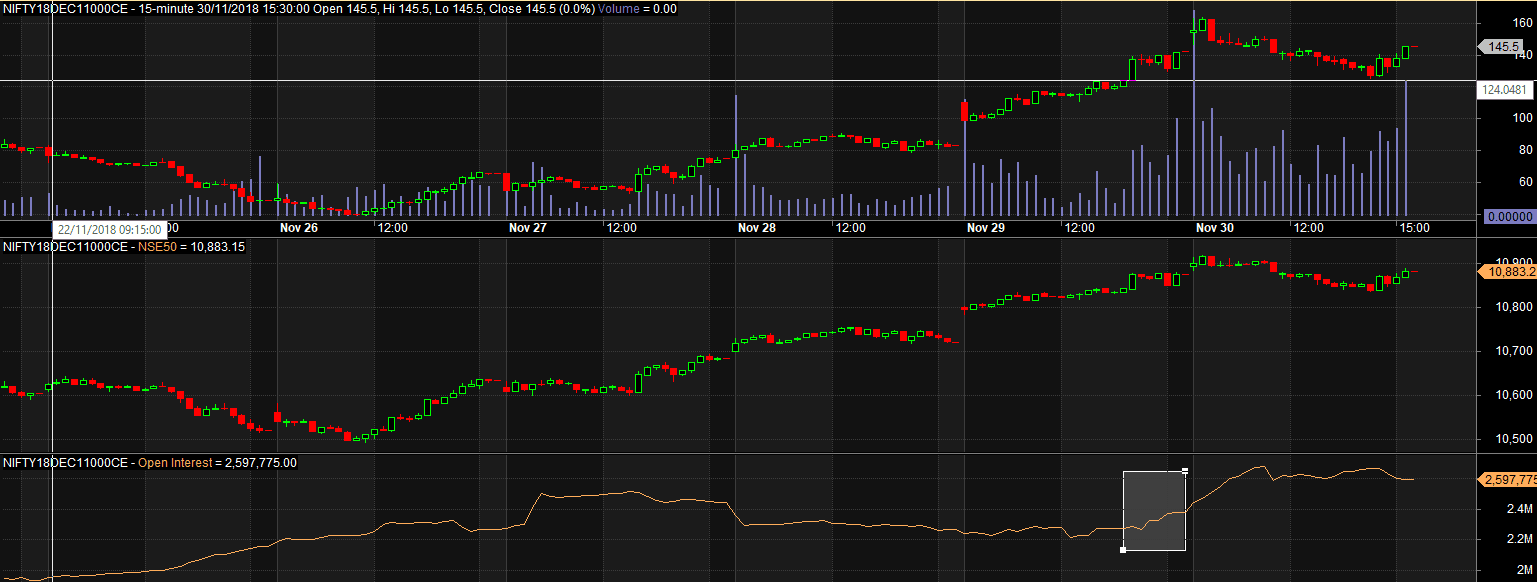
During the same period, we dont see any option OI getting added.
On 10,000 PE and CE also same thing is observed.
This makes me believe that the option writers are not only bullish but super bullish on market expecting breach of 11,000 levels in a very short time.
Final Take
The markets are very close to a favourable trading location and are going to show a decent move. If they close above 11,170 with a full candle, one can go long (partial till it breaks all time high). And if you get closure of the daily trend line below 10,750 – one should build shorts for a target of 10,000 and then 9,000. Time will tell…
nice analysis sir
Thanks Pramod
Sir it is typo shows 2019 in subject line
Thanks. Will change