This post is mainly aimed at long term investors and how they could do analysis of markets and stocks to own. Traders can definitely use some of the concepts mentioned here, but they need few additional items which are beyond scope of this article.
Are the markets getting heated?
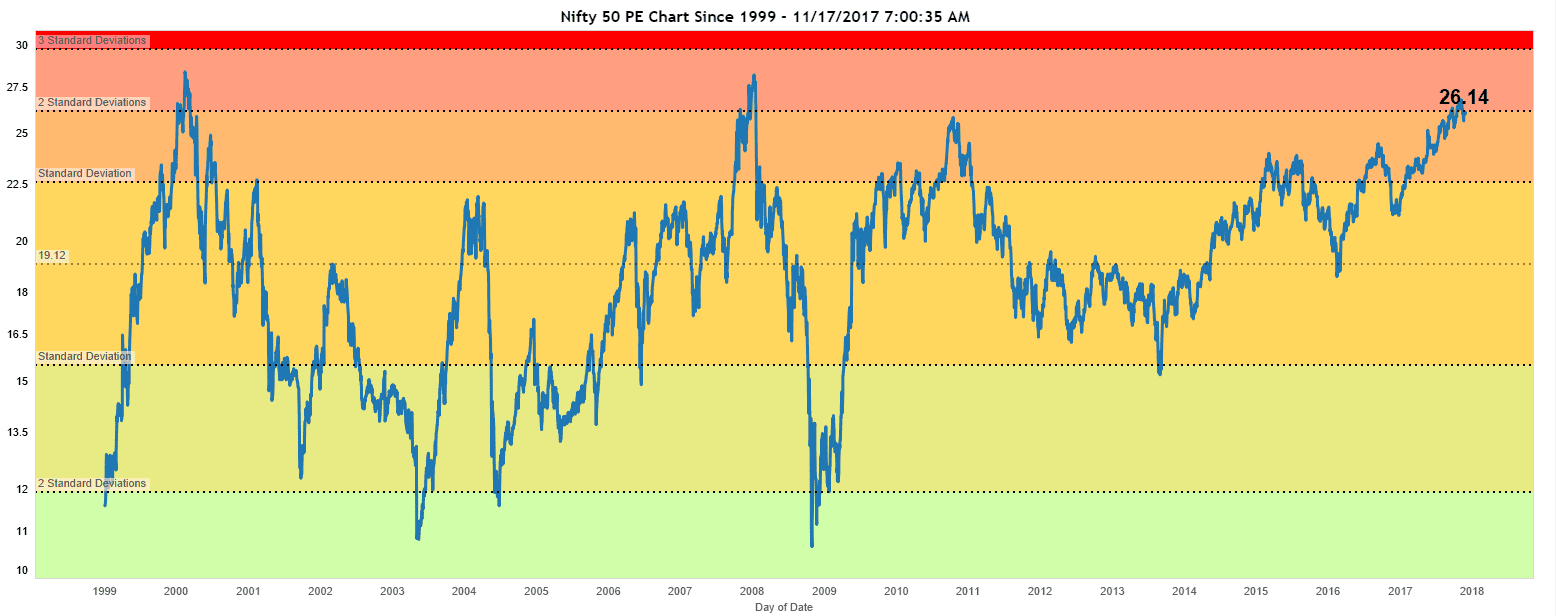
Lets look at PE ratios.

It is very clear that PE of Nifty does not sustain beyond 2nd deviation from the average and usually tops are marked around those levels. You could check with previous tops in Nifty. at 26, we have already crossed that second deviation line at 26.25 and started coming below. These are usually the levels where large players (FII, DII) start selling their inventories.
In 2008 correction Nifty has gone from 6300 to 2900 (54% in about a year)
In 2000 correction, Nifty has seen correction from 1400 to 850 (40% in 8 months)
And now yet again we are around the same level in terms of PE!!!
Is it real? What about excellent political scenario? What about upgrades of economy and all the good news?
Just before the other 2 major falls, general market feel was also extremely positive, probably more positive than today. In 2006-2007 everyone including auto drivers, paan shop owners were talking about the markets… Yes, there are good news. But if you really start looking at details, the large players have huge positions and they are interested in selling their positions without price going down, else, they may start making losses. So they are happy if such an euphoria is created, they can silently exit.

If you notice in the chart above, there has been a lot of selling happening from these large players who invest and trade based on fundamental data. If they are selling, who is buying? Is it the common man who is getting trapped again? Do you want to be that common man?
Idea here is not to create panic, but to show data which can be used for making informed decisions…
Should I sell everything and wait for 50% correction?
The answer is NO.
If I understand technical analysis well enough, I dont think the time is arrived. But as an investor, its better to not worry about timing the market perfectly and to be safe with your own money rather than being sorry. (Remember, if you loose 50% your 100 rupees become 50 and from there for you to get back to 100 – you need a 100% up move and not 50%)
My recommendation to the longer term investors is to do your quarterly/half yearly analysis in the month of December and to reduce your position to have at least 30-40% cash and be only 60% invested. You have enough time.
Another interesting fact based on my observation is that generally markets crash after December. One probable reason is that these FII’s close their books in month of December and if they want to show good year, the markets need to be up in month of December. (This is just an observation and nothing can be accurate when it comes to market)
How is the technical analysis looking?

Nifty monthly clouds show a decent support at 6800 and it may act as a good support, secondly it does not give any idea of any correction so far. (possibly the bubble is yet to form and Nifty may actually go much higher before cracking)

On daily supply demand charts, Nifty has broken uptrend creating a supply area above 10,425. Till we close above 10,500 this supply area should act as a resistance. At the same time, we have respected the first demand area (earlier supply area) at 10,150 and have shown strength. So till Nifty closes below 10,090 we are in sideways move. Next demand area is at around 9700 levels. As this article is not for traders, I am not getting into too much of TA.
Can you explain in lay mans terms?
I dont think top made by market is the last top, yet I believe that we are getting closer to a top. Investors are recommended to be cautiously optimist and be ready with liquid cash in case of a large correction…