Nifty Analysis 11 September – Nifty – Has major correction started? – Possibly…
I really did not have a reason to write blog for many weeks as Nifty was continuing its one way march… Until recently it has shown some correction possibilities. Today I try to analyse Nifty in details.
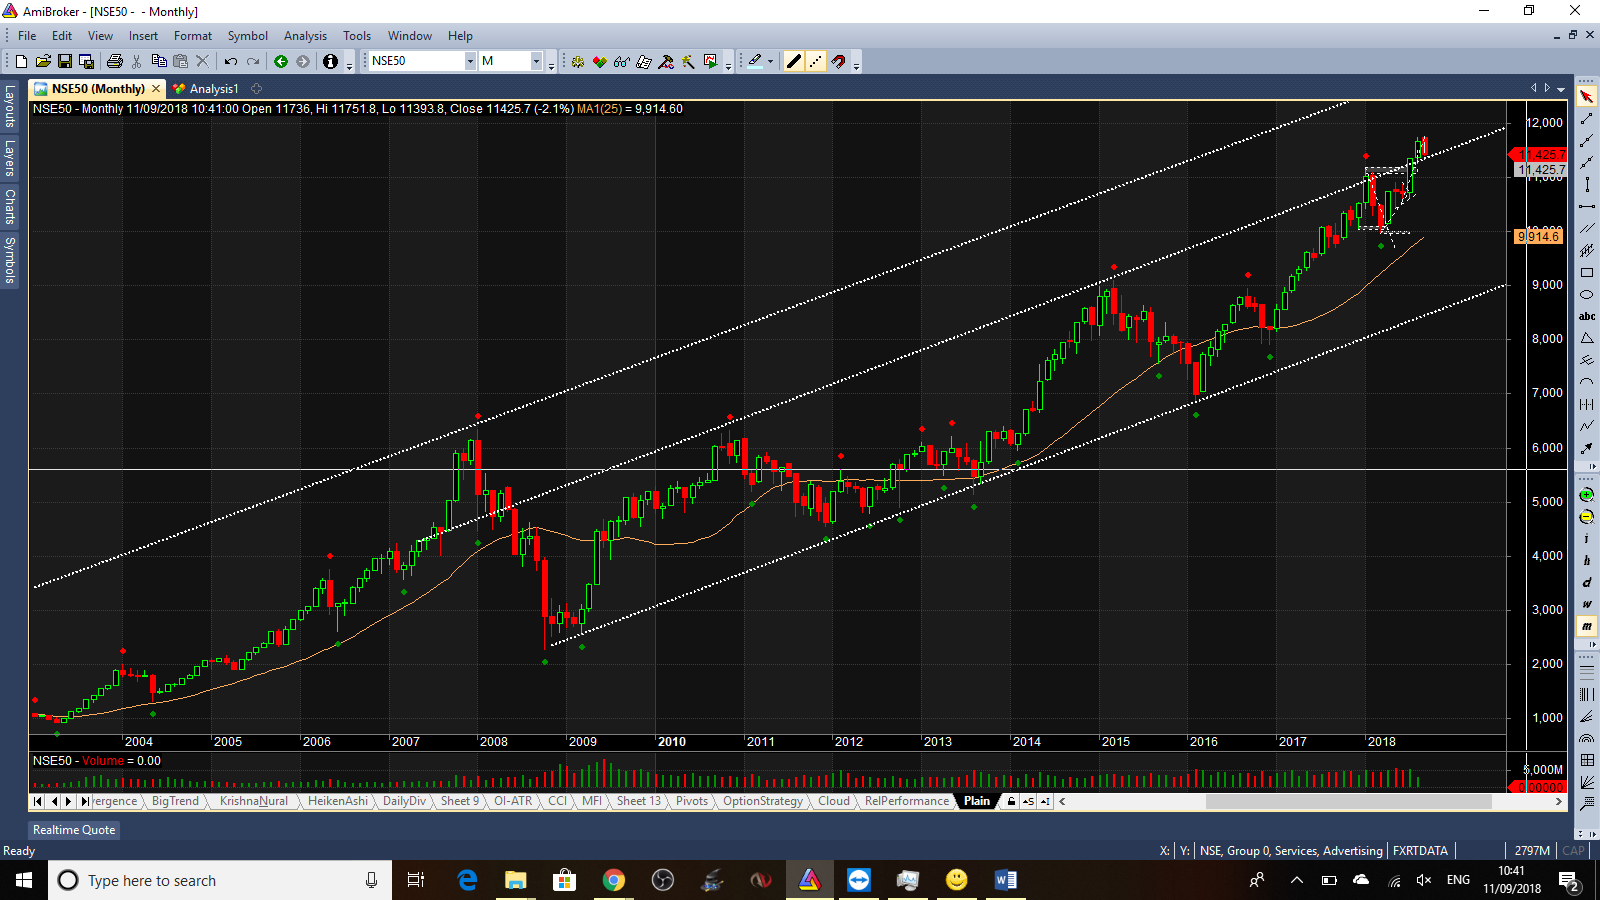
Lets start with Monthly picture.
For many months Nifty has been trading in a channel. We have actually been trying to break this channel and then September has shown some resistance to show a red candle so far (Remember Sep is not yet complete and the candle could change in shape and type)
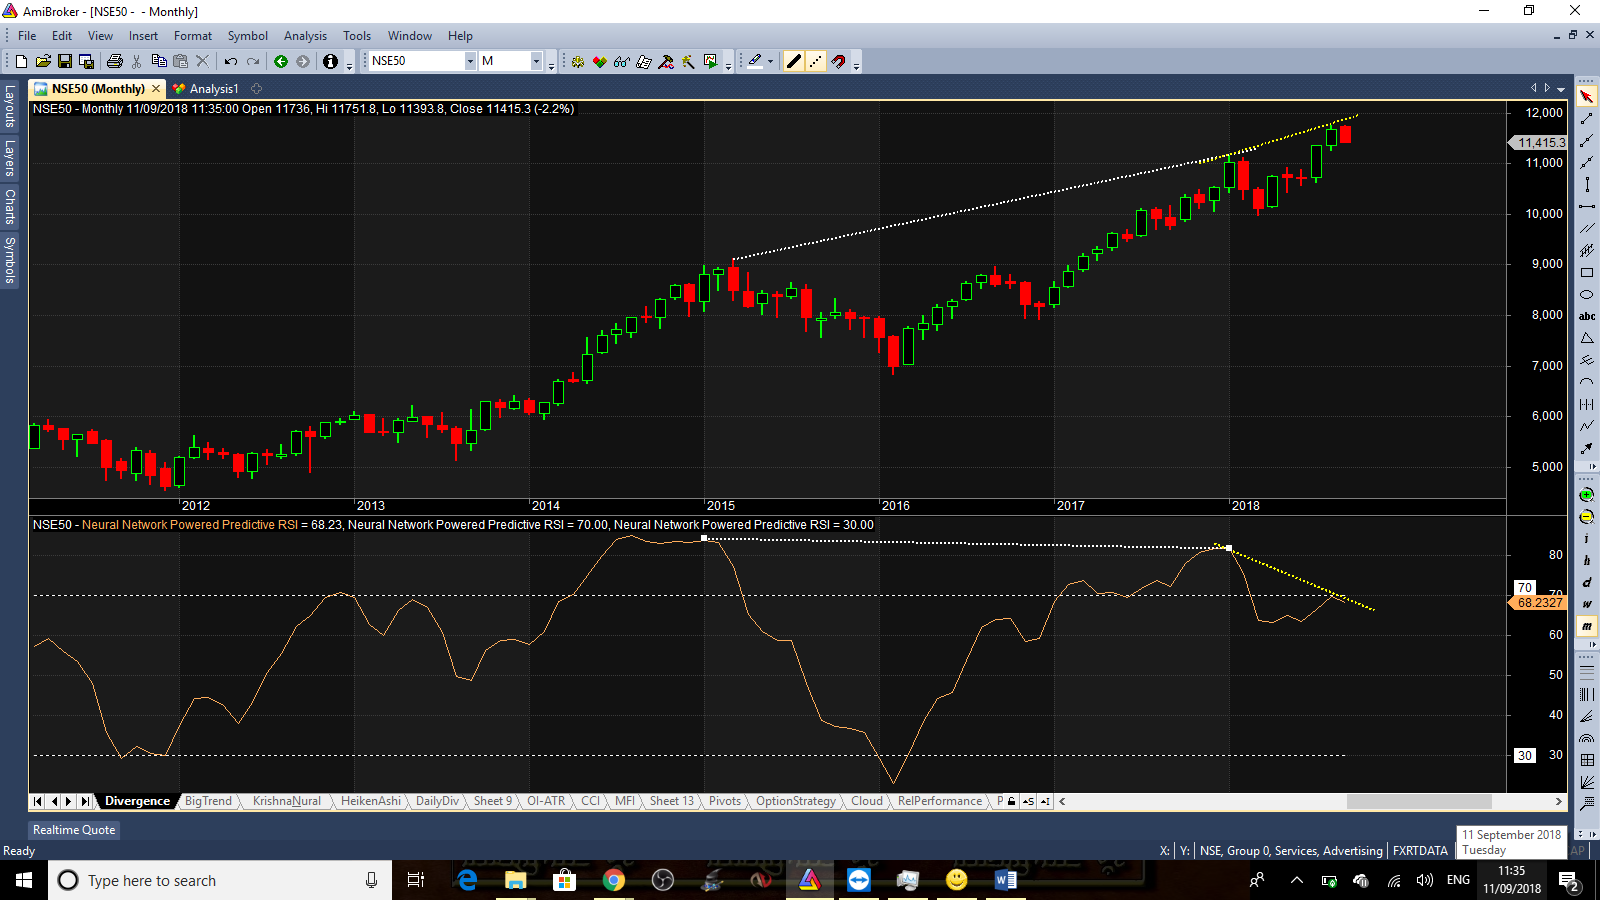
What bothers me is strong divergence created on monthly charts….
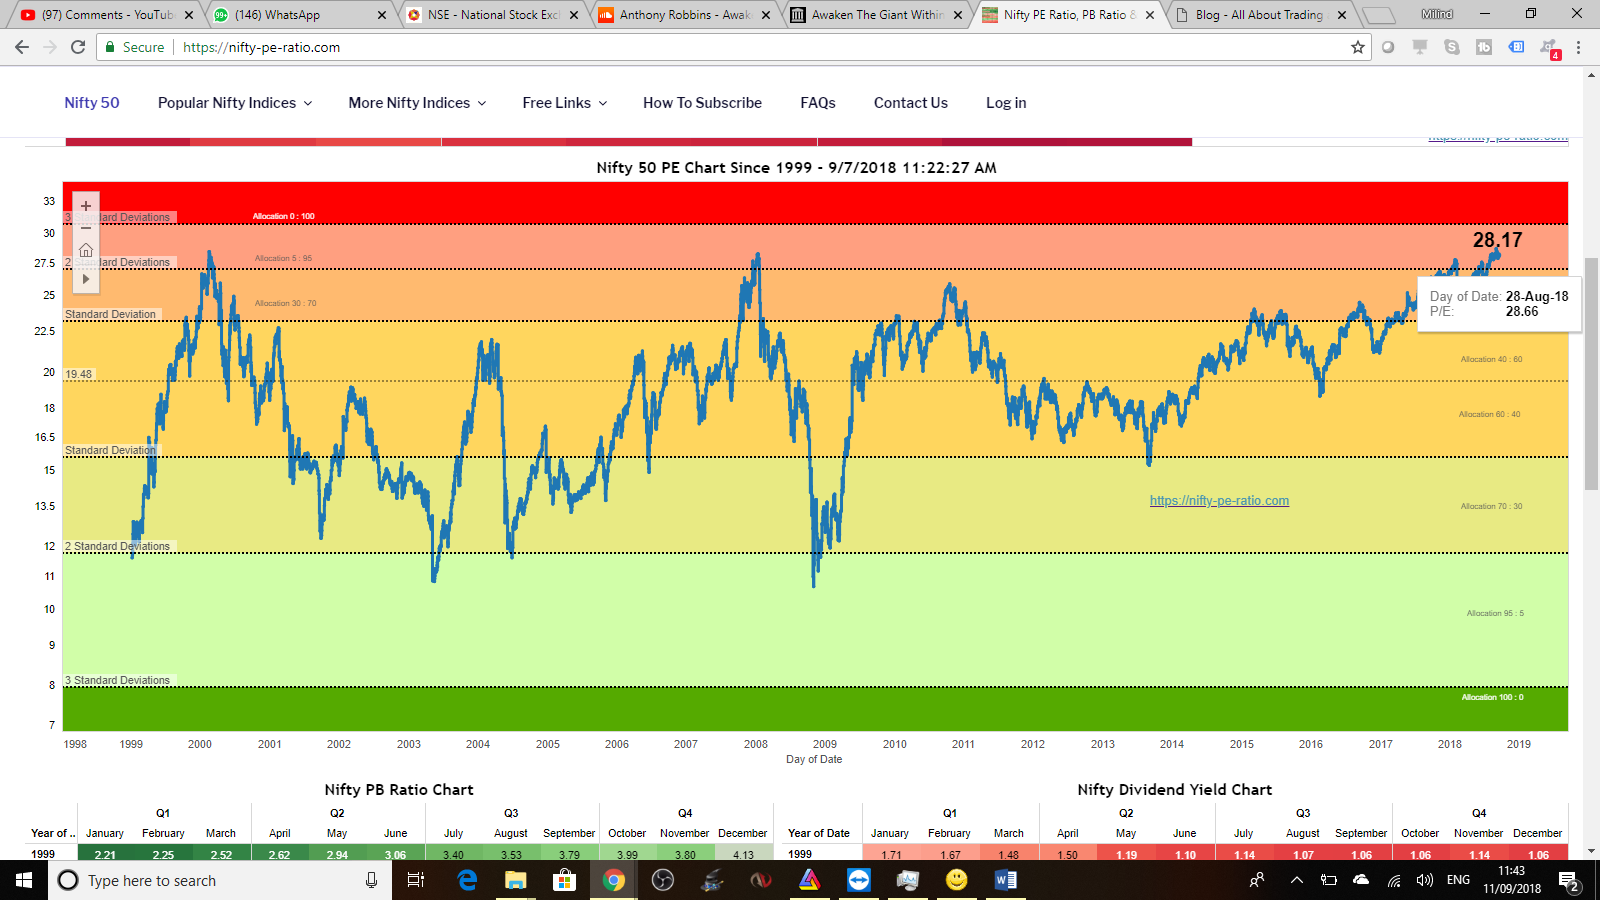
To add to this, on 28 Aug we had lifetime high for Nifty PE ratio at 28.66
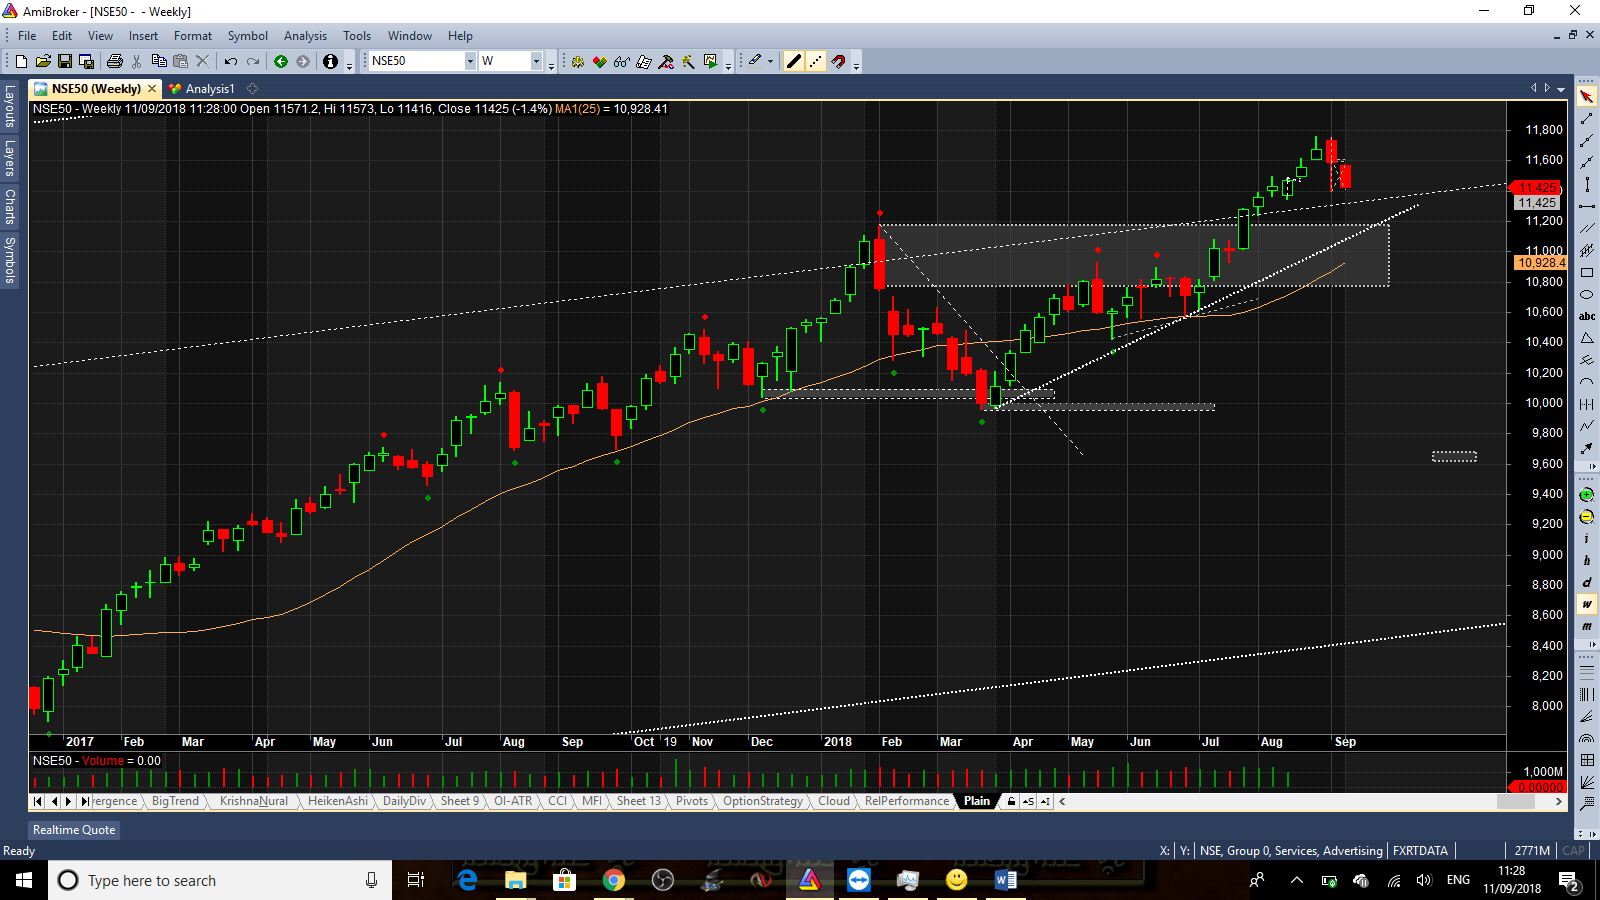
On Weekly, we still are on a very nice upward trend with 11,180 as a decent support.
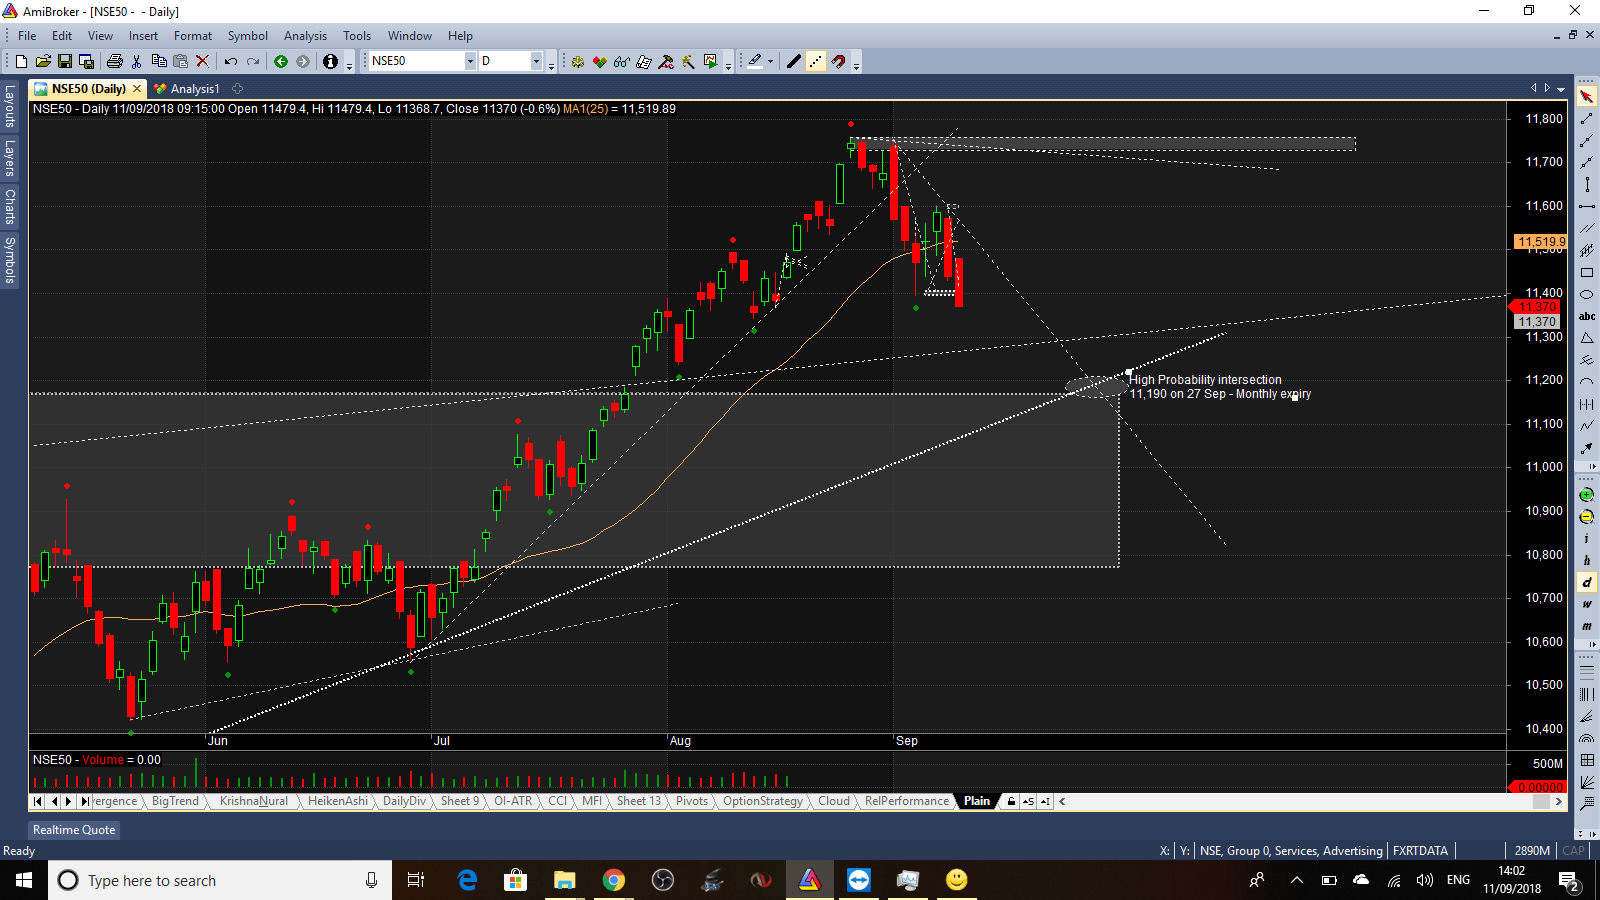
On daily charts we had talked about resistance at 11,180 and also discussed when Nifty successfully broke these levels and 11,180 became a good support area. This break was with a gap which actually is considered as a strong break of resistance.
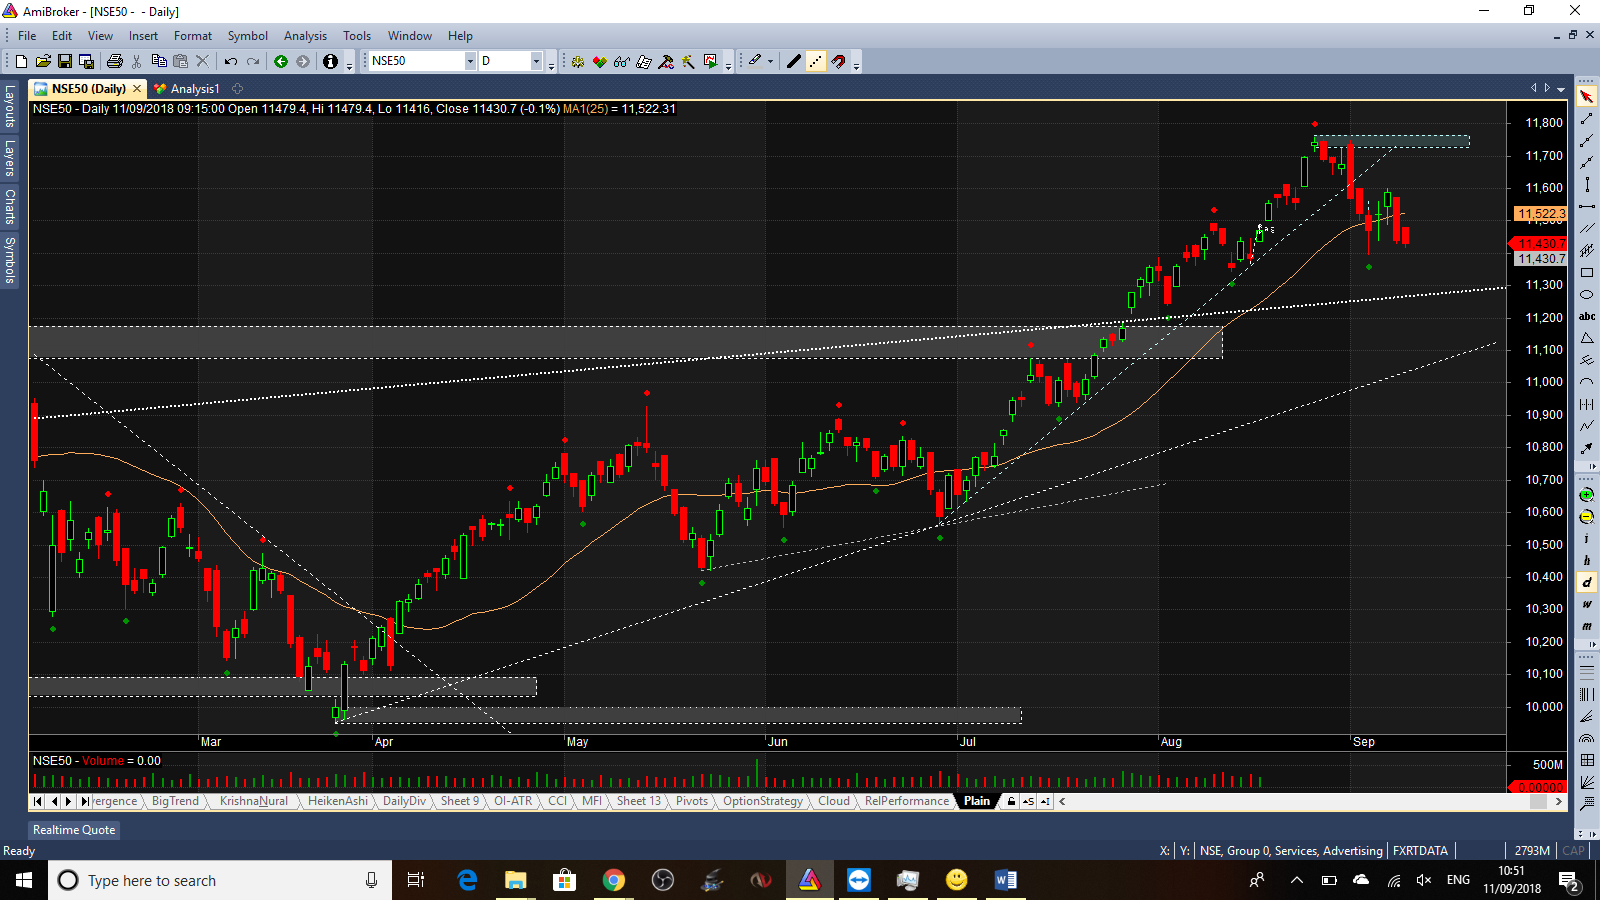
On 4th Sep when we printed full candle below the latest trend line, we broke the trend on daly time-frame.
But we are not yet been able to draw a downward trend line till we see a break of 11,390 levels. Let me explain that on 15 min candle chart.
When this blog has been written (around 11AM on 9th) we see a clear support level around 11,400 which the market should hold and reverse from here on 15 min charts
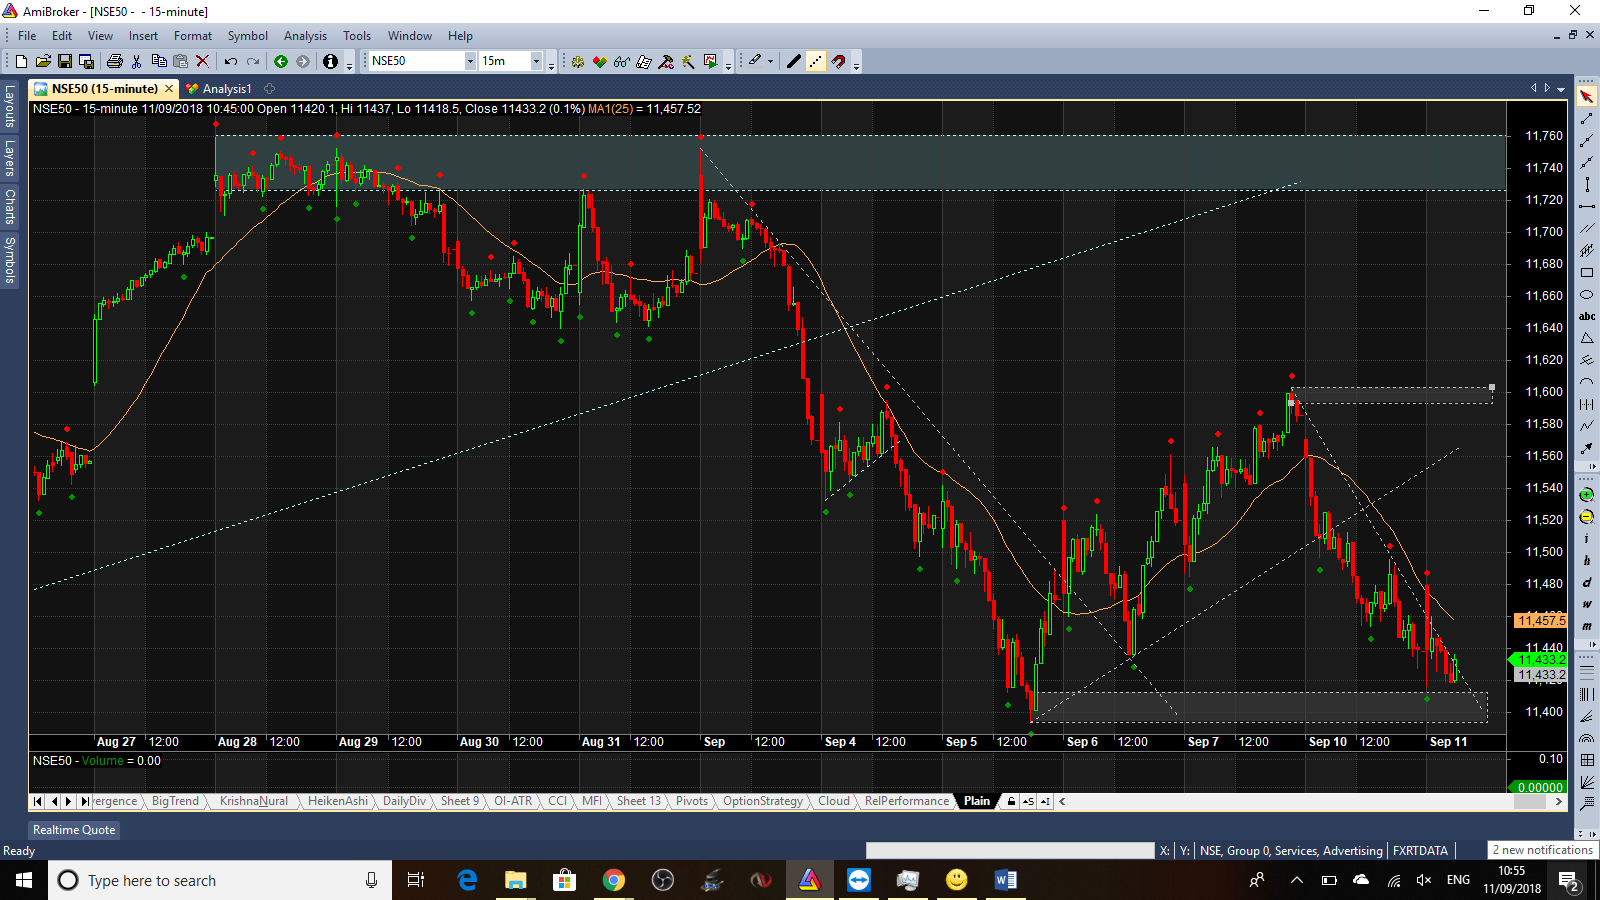
But remember the trend in 15 min is still down till we see a full candle above the trend line. In all probabilities it loosk like a sideways market and we may see another downward push from 11.600 levels. Time will tell.
Finally – the trend is still upward from Nifty with cautious view of possible sideways or downward probability. If the trend gets set and we are able to break 11,390, and then 10,700 we may look at 9,000 levels which will be excellent opportunity for long term traders.
Update – We see a break of 11,390 and a daily downtrend started. This gives high probability intersection at 11,190 for Sep expiry on 27 Sep.