Nifty – has the new rally set in? 20 Oct 2019
On 20 Sep blog we mentioned not to be in a hurry to buy after a rally. On 5th Oct we mentioned again to be cautious. On 10th Oct on Facebook page and also on twitter, we mentioned that looks like daily demand area is coming into play and short sellers to be cautious. Any investor who is following us should have got a decent outcome….
Today’s Analysis in short
After today’s analysis (details below) we believe that Nifty has turned up to be in cautiously optimistic zone. High risk individuals may invest about 20% of their portfolio. A balanced investor should wait for all time high to be broken convincingly.
Todays article has to consider some advanced items hence got little complex. If you need more details, please discuss it on facebook page https://www.facebook.com/AllAboutTradingAndInvesting/ or on twitter – @MilindAPol
Nifty Monthly
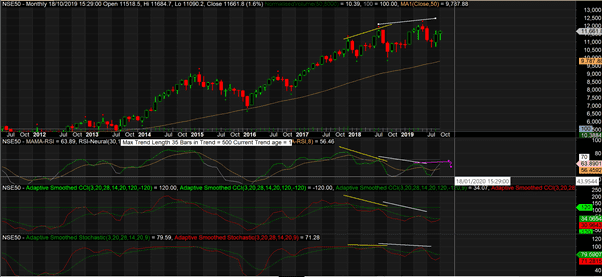
Last few times we skipped talking about monthly charts as there was not much of a change. This week we would like you to watch out monthly RSI. All oscillators had a double diversion on monthly which suggests a possible top. But now RSI is hinting that this will be a failed double divergence. We use word hinting and not being 100% sure because firstly the monthly bar is not complete and we still have more than a week to go. And secondly because other oscillators are still in comfortable double divergence.
But if this double divergence is not respected by markets, expect a start of another bull trend. Yes, the valuations are not recommending a buy, but markets can remain unrealistic for a fair amount of time. That’s why I believe more in technical analysis. All said, we are not yet done with our complete analysis and don’t recommend an action just based on one single RSI value on one timeframe. Lets evaluate other parameters to be confident on our view.
Nifty PE ratio
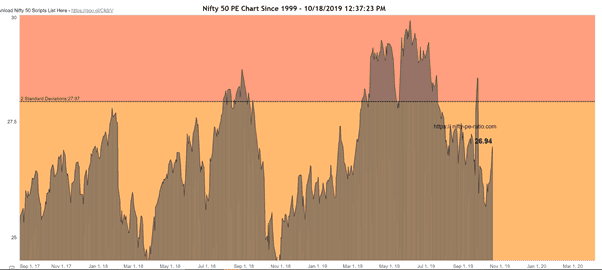
A Close look on PE charts make me believe that a lot of Nifty constituents are showing good results. On Sep 24 Nifty price was around 11,588 and PE ratio was 28.49. on 18 Oct Nifty price was 11,661 nearly half percent up with PE ratio of 26.94 (nearly 5.5% down).
Nifty weekly
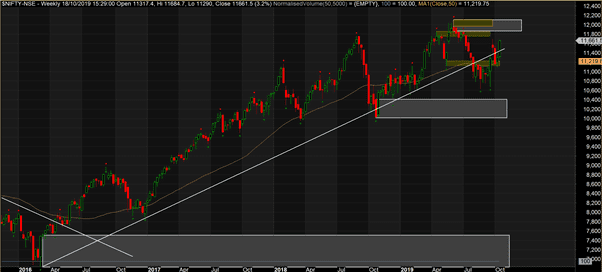
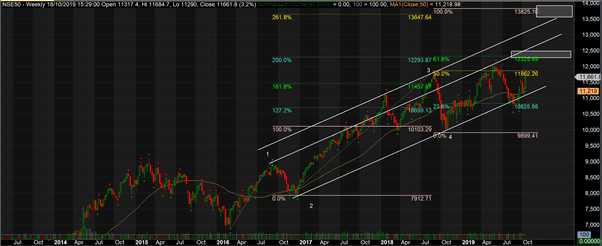
On weekly charts Nifty had broken a trendline successfully in September and made us believe markets may correct. Week after FM announcement on 20 Sep, markets printed whole candle above the trend line followed by another test of the trendline. Currently the price is above this weekly trendline. It does not make us bullish yet. On weekly timeframe, we still are in range – 10,400 to 11,800. Break of All time high will make us sure that the trend has changed.
However if we upgrade our trendline as per Elliot wave 4, then all the action in last few days is only test of the trendline. (Just another way to look at.
While we are talking about Elliot waves, lets try to get targets for this wave 5.
Conversion zone for Fibonacci falls firstly around 12,200-12,300 levels and secondly between 13,500 and 14,00 levels. We recommend long term buyers to be careful around these levels. EW readers may be aware that this last leg of wave 5 is not a proper wave 5 structure and has high chances of truncating early.
Nifty daily
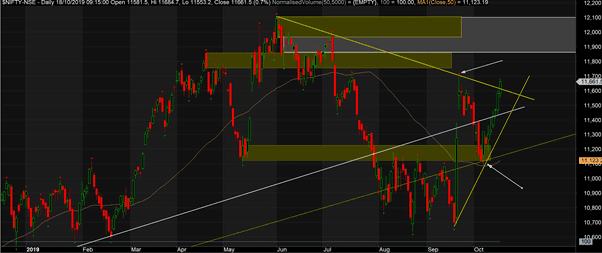
On 23rd Nifty respected the daily trend line and also the demand area on 9th October. Yesterday it has challenged the downward trend line. We consider break of trend line only after having full candle above the line. There also is not a new trendline coming from demand area as we broke the high of 23rd (closing basis). Looking at this chart we belive markets will go on to test 11,850 quickly. Beyond that till 12,100 the markets will face stiff resistance from bears. With such vertical rallies the falls also can be vertical. And one should wait till successful break of all time high before going long aggressively.
Options Analysis
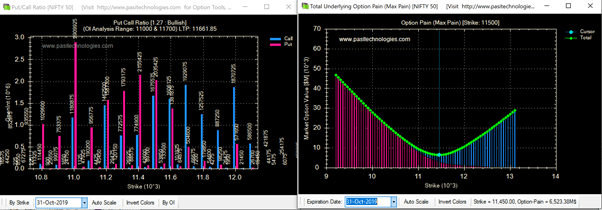
Option analysis with max pain at 11,500 and highest Call written on 11,700 give clue that markets may not go up in a hurry. Put/Call ratio of 1.27 is fairly bullish though.
Sectoral Analysis
Next coming days and weeks we will see sectoral rotation and hence today we give weekly sectoral reviews
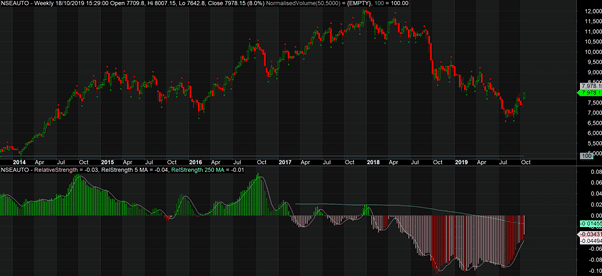
Auto
Since last few weeks this sector is showing some bottoming signs. Bulls should keep an eye.
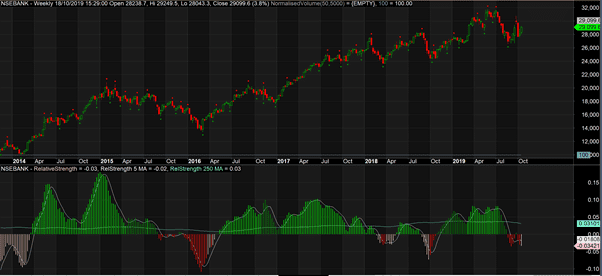
NSEBank
Banks usually outperform Nifty. But this time around on weekly they still have not started outperforming.
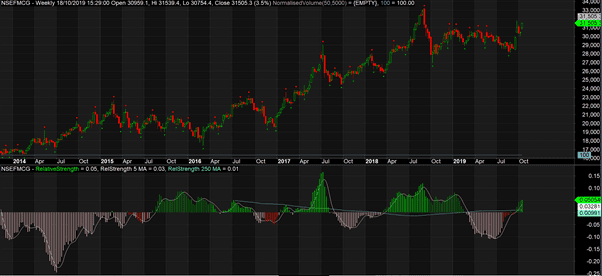
FMCG
FMCG is giving lot of support to markets since May/Jun and continues to drive. You may invest in this sector a little.
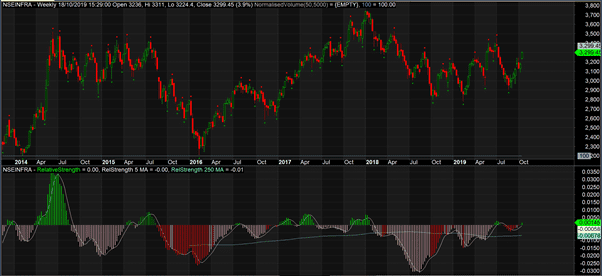
Infra
Historically this sector does not do much – sideways since 2010. But it shows some signs of out performance. If towards higher levels you find nifty topping out, evaluate this sector to go short
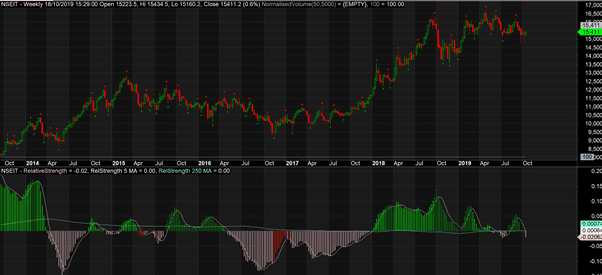
IT
Expect IT sector to under perform in mid term compared to Nifty.
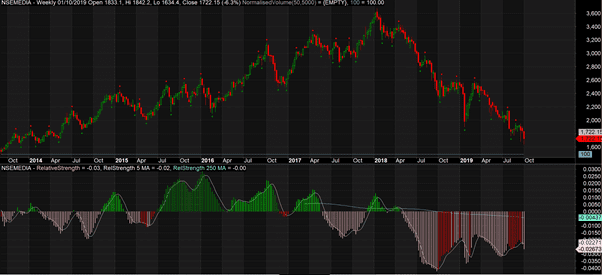
Media
Media – keep away from this sector…
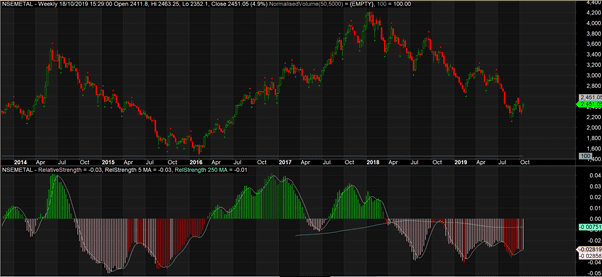
Metal
This is another sector which is rotational in nature. We believe the current downcycle not over for Metal
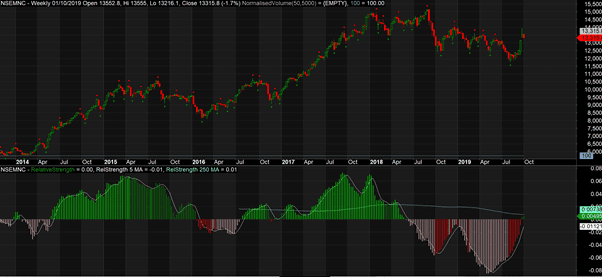
NSEMNC
This is a must to have sector in ones portfolio. As it mostly outperforms Nifty. And its currently available at a discount. One may invest a little if believes that Nifty will go to all time high. Following of its constituents are looking extra strong (not in any order).
- Ashok Leyland
- Bata India
- Britannia
- Hindustan Unilever
- HONAUT
- Maruti
- Nestle India
- Proctor and Gamble
- SKF India
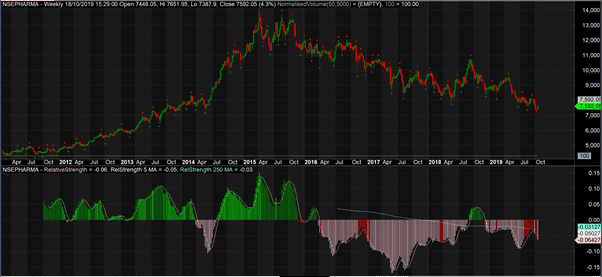
Pharma
After topping out in 2015, this sector still remains under pressure. Use every rally to exit.
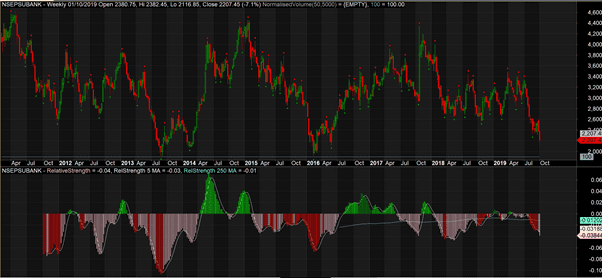
PSUBank
Another sideways sector. Should be avoided at all times. Currently in downward trend
