What a move by markets…. We lately had a view of possible bear phase since July last year. We also recommended reduction of equity positions almost at top – https://learn2invest.in/nifty-has-major-correction-started-possibly/ and https://learn2invest.in/nifty-detailed-analysis-and-how-to-approach-market-in-this-correction/
All the while we were watching for a level of 11170 for bull hat to be taken.
On 10th Feb 2019, we recommended a good risk reward short setup which also gave decent returns of 400 Nifty points in about 6 trading days. https://learn2invest.in/possible-good-trade-setup-20190211/
This setup took support on the weekly support line and made us revisit the downward bias.
On 11th march when nifty crossed our supply zone of 11170, we also updated on facebook (https://www.facebook.com/AllAboutTradingAndInvesting/) and other channels of possible fast upmove to 10,400+ levels. Now here we are already above 11400.
I am sure a lot of you readers would have been able to preserve your capital and also able to get decent returns in FD and other defensive products for loast 6+ months. As we mentioned earlier, we were in a possible wave 4 which is extremely difficult to trade even for experienced traders. Lets do the analysis on how we see future.
Valuation of Nifty
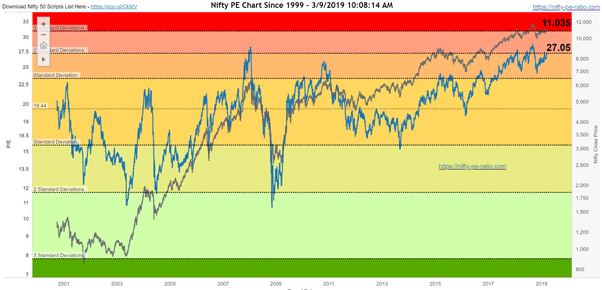
As we keep saying, Nifty valuation is stretched. We are towards high point of 2nd deviation of the PE ratio. While markets can remain unreasonable for a long time, it is unlikely that a large FII investment will come at these valuations. Of course there is a possibility of better earnings and a sideways market or relatively short rally. But don’t expect a 100% kind of rally that we got in 2014 after last elections. Around that time we were trading below a PE of 20.
Monthly charts –
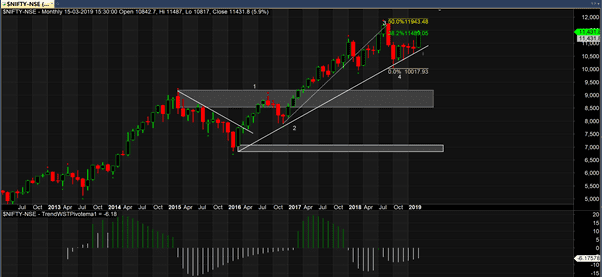
We have tried to put Elliot wave counts on this monthly chart. We believe that we have finished wave 4 (unless we see a break below 10,000) and we are going into wave 5.
Let me now take this opportunity to talk about wave 5 structures, unline 3rd wave, wave 5 takes lots of twists and turns. Whil wave 3 clearly shows an impulse and one directional move, wave 5 will have deeper corrections within. At times it also makes you believe that its finished and you should go short and suddenly shows a large movement in the direction. While wave 3 is great for long term investors with an approach of buy and hold tight, wave 5 gives opportunity also to traders to make money both sides. Hold and sit tight also works for wave 5 as long as you are able to define where to exit correctly.
The weekly chart
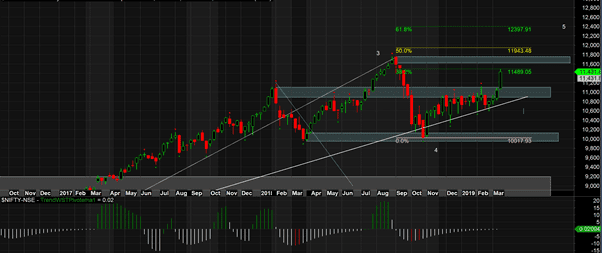
Our first target for this rally was 38% run of wave 3 which is where this week candle is making a high 11490. This weekly candle is largest weekly candle since almost 2 years. Next weekly supply level starts at 11600 levels. And a break of 11760 will take us to uncharted territory.
Remember, a lot of times, markets do retrace back to major supply and demand area before breaking out completely. So if you have missed this candle, you still would get a chance to enter when markets come closer to 11,200 levels. While its too early to give levels for wave 5, a 61% of wave 3 should be a decent level to take it for now as wave 3 was an extended wave. Which is at 12,400 levels. These levels however will get clear when we approach these levels and start observing daily supply demand levels.
The daily charts
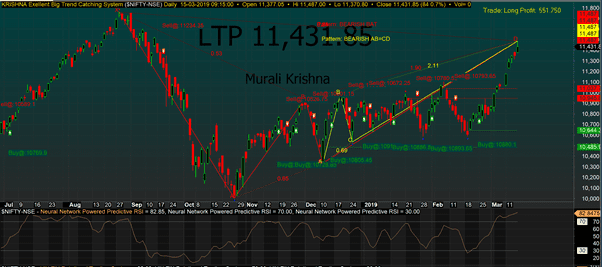
There is nothing much on supply demand levels for daily charts. But its good to observe. A few gaps. Most of the times, markets come back to fill the gaps. This is why I expect a level of 11200 soon enough to give investors another opportunity to add to their positions.
Secondly, we see 2 bearish harmonic patterns getting developed with last daily chart. This does not change fabric of underline market, but just suggests a short term correction.