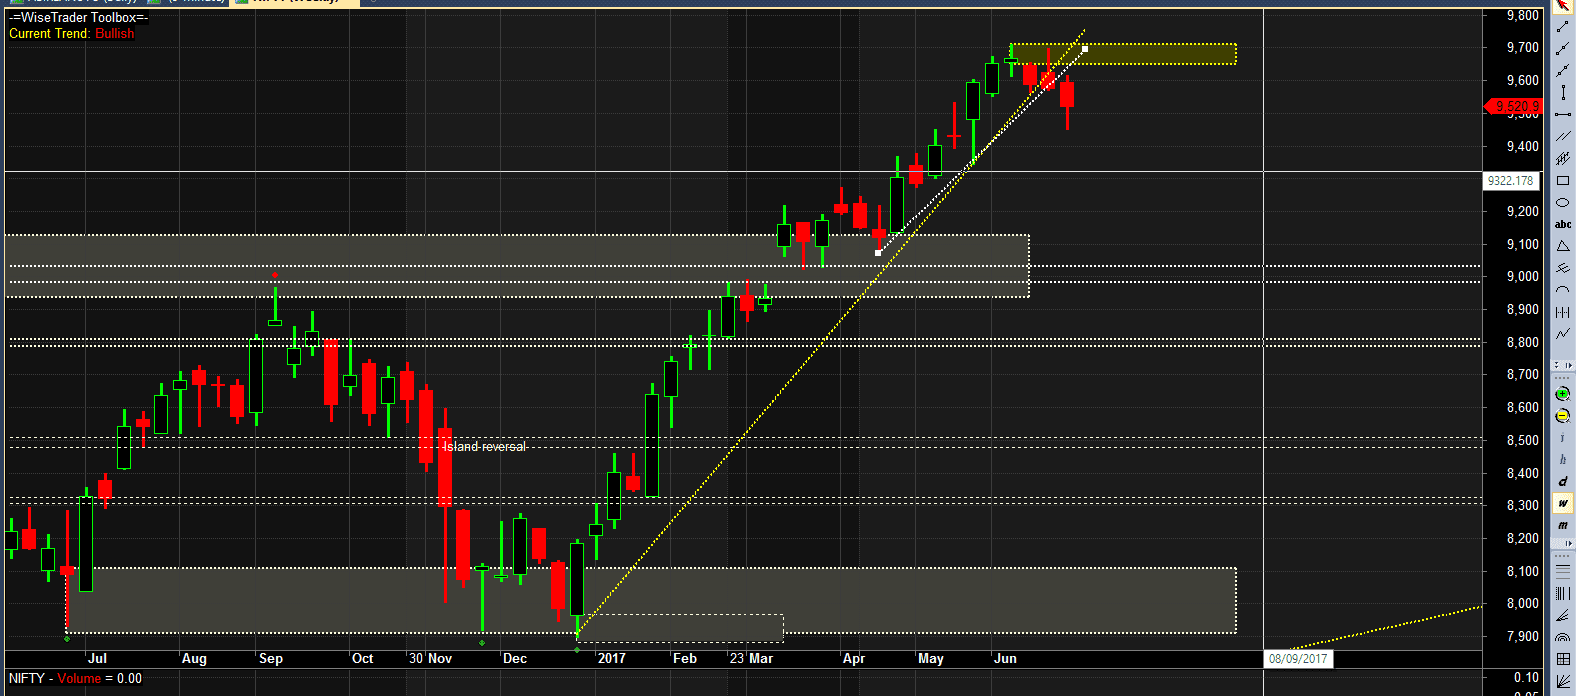
 Nifty weekly chart shows breal of the trend line and it has created a good resistance area around 9650 levels. If market wants to do what I see it doing, then we have printed a top for few weeks now. I expect it to correct from here with 9600-9650 to be a very good shorting area for short term traders. next support on weekly may emerge near 9150 around. However there are a lot of daily support areas from where you may see a bounce.
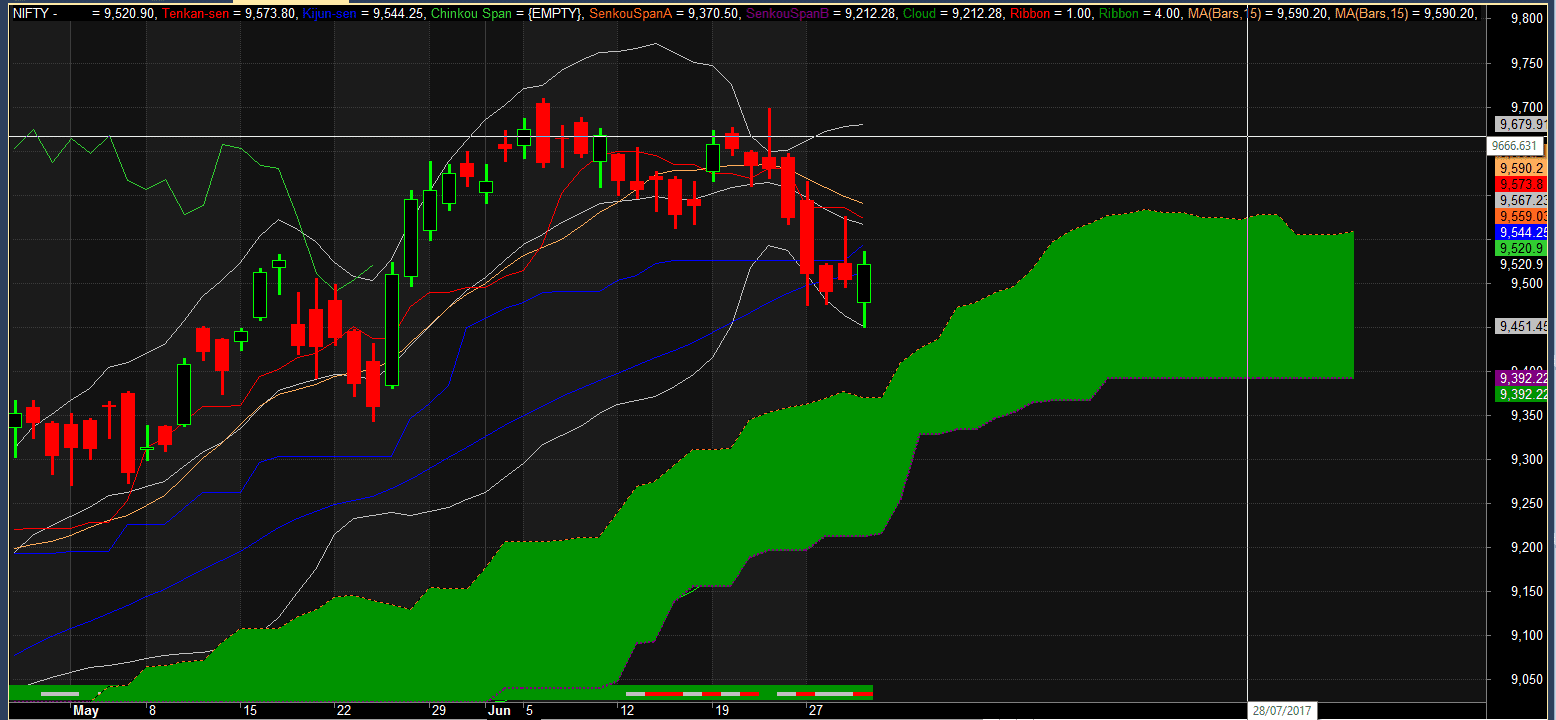 However Daily cloud shows a strong support at around 9400 levels where one may witness a pullback… Similarly weekly cloud is also thick green, This makes me recommend investors to be invested…
If you see break of 9400 levels (daily cloud) you may evaluate reducing your equity portfolio.
But remember, we are in a very strong bull trend and a fast recovery is not ruled out.
<this and every other post on this site is only meant for learning purposes. we believe in teaching you to fish and not to give readymade fish in your hands>
https://www.facebook.com/AllAboutTradingAndInvesting/
Thanks for your ideas n opinions.Can we short position in current level market .short term
I in deed have taken a short position and in my today’s blog describe it…
https://learn2invest.in/nifty-options-strategy-manage-options-positions-get-always-profitable-position/
Its not a good time to short Nifty… If you are a day trader, go ahead and try your luck…